The network for creativity
Join 1.25M professional creatives like you
Connect with clients, get discovered, and run your business 100% commission-free
Creatives on Contra have earned over $150M and we are just getting started
Back to feedPost

Project Title:
E-Commerce Sales Performance Dashboard
Overview:
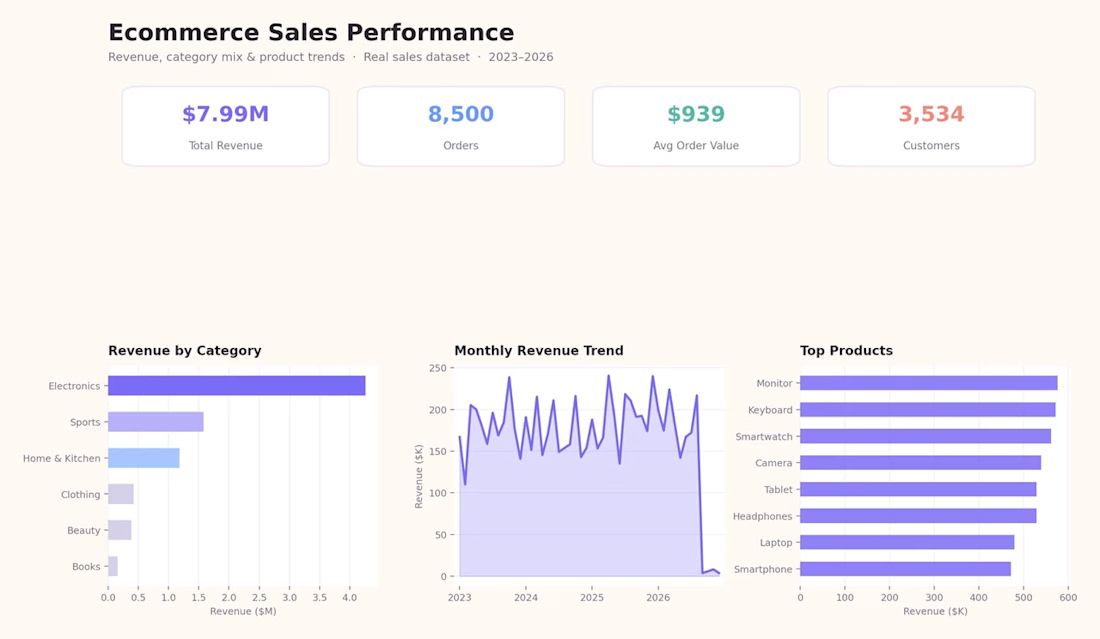
An interactive e-commerce analytics dashboard designed to analyze total revenue metrics, customer acquisition, and multi-category product performance. This dashboard aggregates high-volume transaction data to highlight sales trends, top-selling inventory, and average order values for retail growth optimization.
Key Features & Metrics Tracked:
Core KPI Header: Top-level summary tiles displaying Total Revenue ($7.99M), Total Orders (8,500), Average Order Value ($939), and Total Unique Customers (3,534).
Revenue by Category: Horizontal bar chart illustrating revenue distribution across distinct product lines.
Monthly Revenue Trend: Line chart tracking revenue fluctuations and seasonality patterns over multi-year operational cycles.
Top Products Ranking: Ranking visual highlighting best-selling individual items by total sales volume.
Tools & Skills Used:
Microsoft Excel, Data Analytics, Dashboard UI Design, Data Visualization, E-commerce Reporting, KPI Analysis. 🚀
The network for creativity
Join 1.25M professional creatives like you
Connect with clients, get discovered, and run your business 100% commission-free
Creatives on Contra have earned over $150M and we are just getting started





Related posts

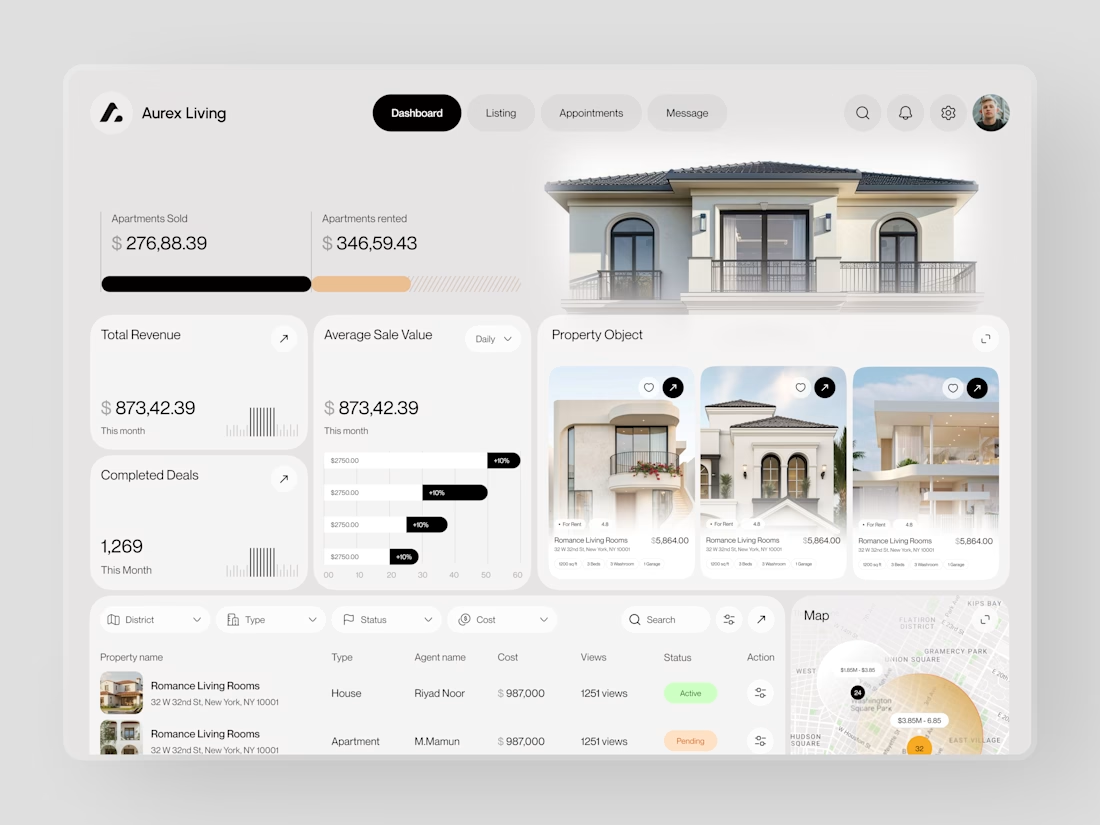
Real estate dashboards are usually built for data entry. Aurex Living was built for decision-making.
$873,42.39 total revenue. 1,269 completed deals this month. $276K sold, $346K rented. Property cards, agent tracking, map view, average sale value trending +10% - every number a real estate operator actually needs, on one clean white canvas.



Vänster Home GmbH
For Vänster Home GmbH, I engineered a high-end European e-commerce build designed to reflect modern architectural design and premium living space aesthetics. The goal was to establish strong brand authority through minimalist visual hierarchy, custom collection navigation, and high-converting storytelling.
I structured the homepage around a cohesive "Designed for..." campaign framework (covering Living, Dining, Lighting, and New Arrivals) to guide buyer intent seamlessly. To maximize user trust and clarity, I completely restructured the inventory data transforming long, cluttered supplier titles into refined product names paired with standardized technical specifications and lifestyle-focused features. This build demonstrates complete end-to-end e-commerce architecture, from editorial layouts down to conversion-focused product listings tailored for luxury retail shoppers.




Clean restructure from supplier titles to real product names, that step alone usually gets skipped. For a GmbH store selling into the rest of the EU, did you end up handling VAT-inclusive pricing per country through Shopify Markets, or did the client stick to one DE price shown everywhere?

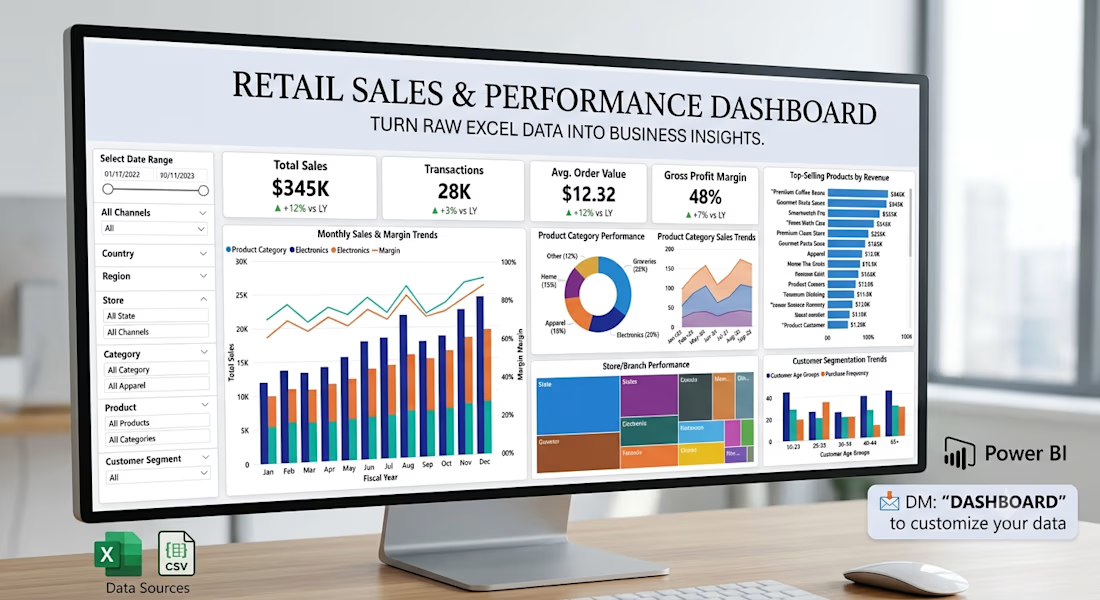
📊 Turn Your Excel Data Into a Clear Business Dashboard
Still managing your business reports in Excel and spending hours trying to understand your numbers?
I help small businesses turn their existing Excel/CSV data into simple, interactive Power BI dashboards.
With a dashboard, you can quickly track:
• 📈 Sales performance
• 🏆 Top-selling products
• 👥 Customer trends
• 🏪 Store/branch performance
• 📦 Product performance
• 🎯 KPIs and monthly targets
I recently built a retail analytics dashboard using Power BI, with data cleaning and transformation using Excel/Power Query.
I'm currently looking to work with small businesses, retailers, and growing teams that want their data to be easier to understand and use.
💬 If you already maintain your business data in Excel, feel free to message me. I'd be happy to show you what a dashboard could look like for your business.