The network for creativity
Join 1.25M professional creatives like you
Connect with clients, get discovered, and run your business 100% commission-free
Creatives on Contra have earned over $150M and we are just getting started
Back to feedPost

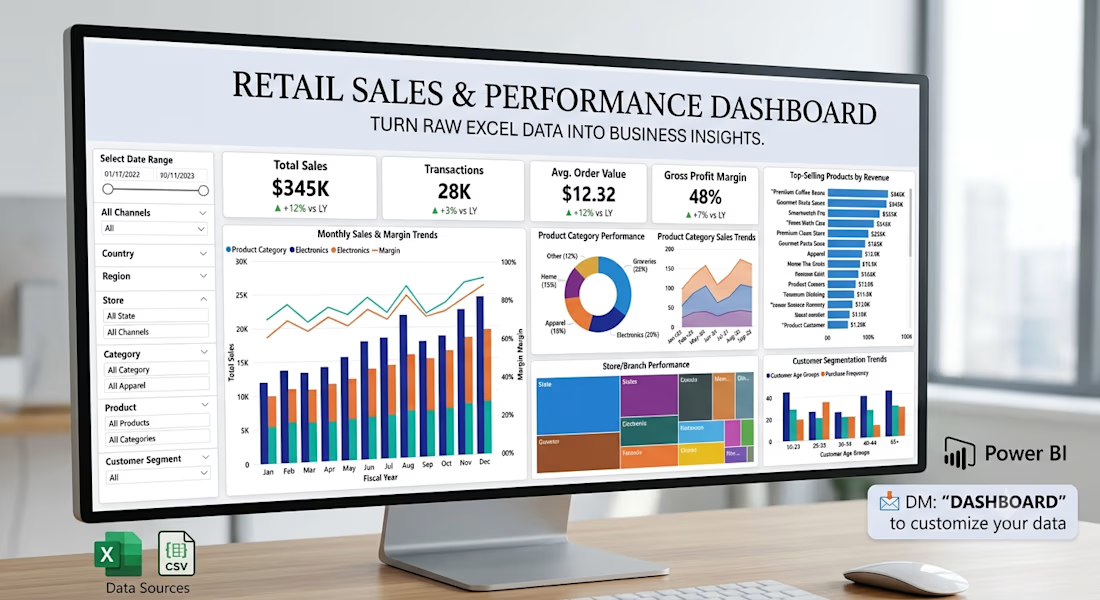
📊 Turn Your Excel Data Into a Clear Business Dashboard
Still managing your business reports in Excel and spending hours trying to understand your numbers?
I help small businesses turn their existing Excel/CSV data into simple, interactive Power BI dashboards.
With a dashboard, you can quickly track:
• 📈 Sales performance
• 🏆 Top-selling products
• 👥 Customer trends
• 🏪 Store/branch performance
• 📦 Product performance
• 🎯 KPIs and monthly targets
I recently built a retail analytics dashboard using Power BI, with data cleaning and transformation using Excel/Power Query.
I'm currently looking to work with small businesses, retailers, and growing teams that want their data to be easier to understand and use.
💬 If you already maintain your business data in Excel, feel free to message me. I'd be happy to show you what a dashboard could look like for your business.


The network for creativity
Join 1.25M professional creatives like you
Connect with clients, get discovered, and run your business 100% commission-free
Creatives on Contra have earned over $150M and we are just getting started





Related posts

I designed and developed a Spotify-inspired Music Analytics Dashboard in Microsoft Power BI, combining data modelling, DAX, interactive navigation, and custom dashboard design into a single analytical experience.
The dashboard allows users to explore music data from different perspectives — from overall performance and popularity to individual artists, songs, albums, and trends over time.
What I built
- Overview Dashboard — high-level KPIs and music performance trends
- Artist Analytics — artist rankings, song counts, popularity and catalogue analysis
- Song Analytics — song popularity, duration, year-wise analysis and album insights
- Interactive Navigation — seamless movement between dashboard sections
- Dynamic Visual Analysis — monthly trends, popularity patterns and category comparisons
- Detailed Data Tables — deeper exploration beyond summary-level KPIs
- Spotify-inspired UI — dark, modern interface designed around the visual identity of a music streaming platform
Key metrics explored
- 342 Artists
- 789 Distinct Songs
- 562 Albums
- Average Song Duration: 3.28 minutes
- Average Popularity: 90
Tools & Skills
Power BI · DAX · Data Modeling · Data Visualization · Interactive Dashboard Design · KPI Development · Business Intelligence
The goal wasn't simply to create another Power BI report — it was to make the data explorable, intuitive and visually engaging.
Interested in turning your own data into an interactive Power BI dashboard? Let's connect.

Welcome! Are you looking to turn messy data into clear, actionable insights? You're in the right place.
As a professional data analyst, I specialize in transforming raw data into clean, structured, and visually compelling dashboards that help businesses make smarter decisions.
What I Offer:
• Data Cleaning & Preparation (Handling missing values, removing duplicates, formatting)
• Exploratory Data Analysis (EDA) to find key trends and patterns
• Interactive Dashboards & Reports (Power BI/ Excel)
• Custom DAX / SQL queries for deep metric tracking
• Professional summary report with key business insights
Tools I Use:
• Power BI
• Python & SQL
• Advanced Excel & Google Sheets
Why Choose Me?
• High-quality, clean design with user-friendly layouts
• Fast turnaround time and clear communication
• 100% satisfaction guarantee
Let's unlock the story behind your data! Please contact me before placing an order so we can discuss your specific project goals.

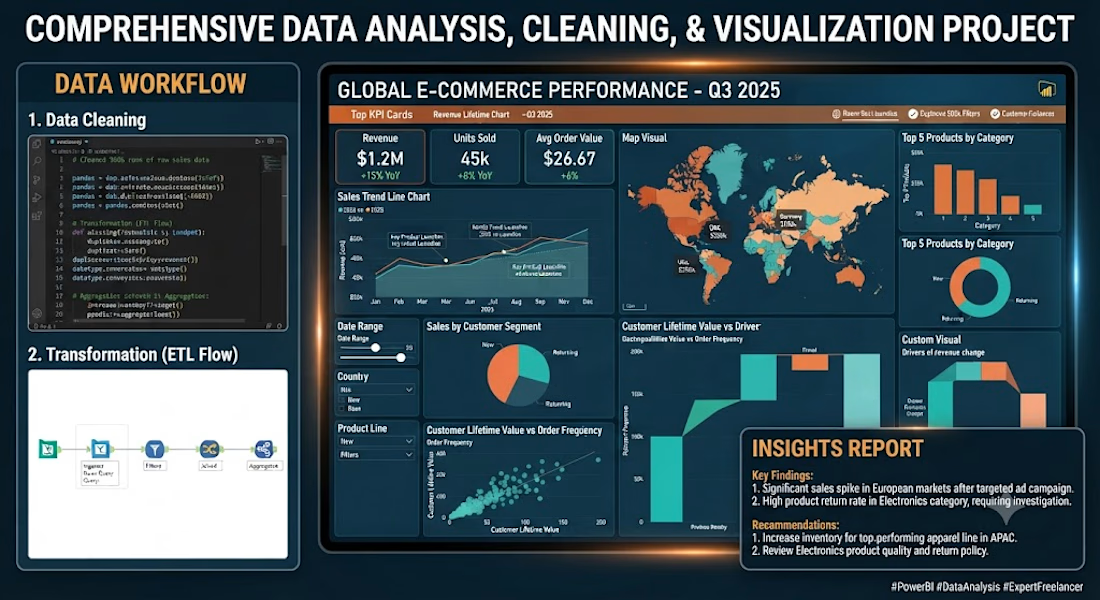

🚀 BrightMart Retail Sales & Performance Dashboard
I recently designed and developed this interactive Power BI dashboard as part of a job assignment. The goal was to analyze retail sales, customer trends, and product performance for BrightMart.
📊 Key Features:
• KPI Summary: Tracking Total Sales ($2.03M), Total Orders, Quantity, and Customers.
• CY vs. PY Revenue: Monthly sales trend comparison between the current and previous year.
• Top/Bottom Performers: Dynamic toggle to instantly view top 10 and bottom 10 products.
• Interactive Slicers: Custom collapsible panel to filter by Region, Category, and Brand.
• Data Modeling: Built on a Star Schema model with custom DAX measures for optimal performance.
This project was created as a job assessment task to demonstrate end-to-end data transformation, modeling, and dashboard visualization.
Feedback and suggestions are welcome! 👇
#PowerBI #DataAnalytics #BusinessIntelligence #DataVisualization #RetailAnalytics #PowerBIDashboard #DAX #DataAnalysis #JobAssignment #Portfolio #Analytics
Data AnalysisMicrosoft Power BImicrosoftfabricGoogle GeminiBusiness StrategyData EngineeringMicrosoft Excel

