The network for creativity
Join 1.25M professional creatives like you
Connect with clients, get discovered, and run your business 100% commission-free
Creatives on Contra have earned over $150M and we are just getting started
Back to feedPost

The Challenge:
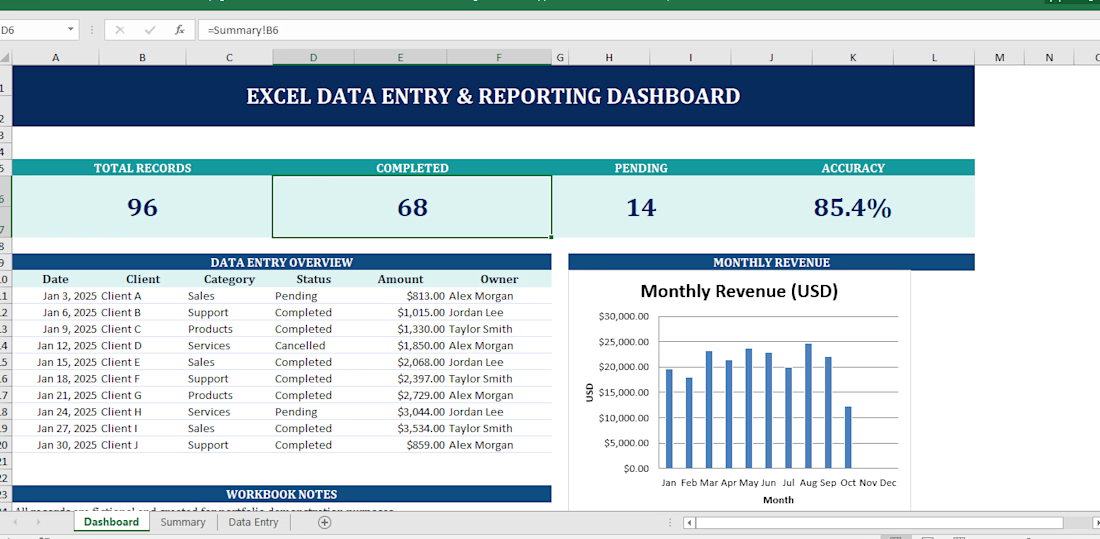
An enterprise team was manually copying, pasting, and merging fragmented financial CSV files every week to track operational runway. This manual process led to syntax errors, broken formulas, and a total lack of forward-looking cash flow visibility for executives.
The Solution:
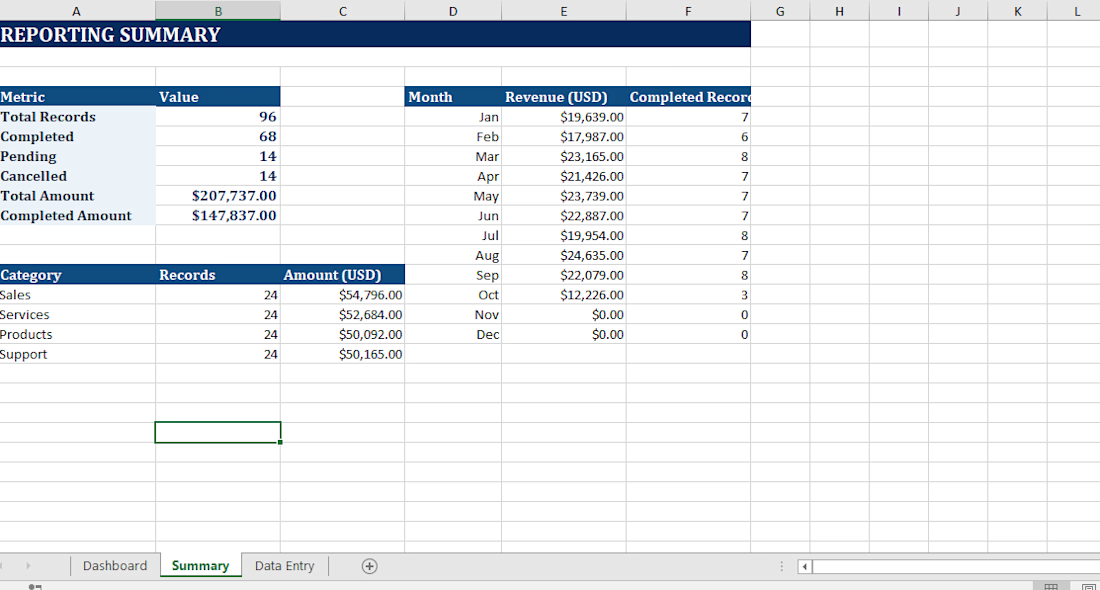
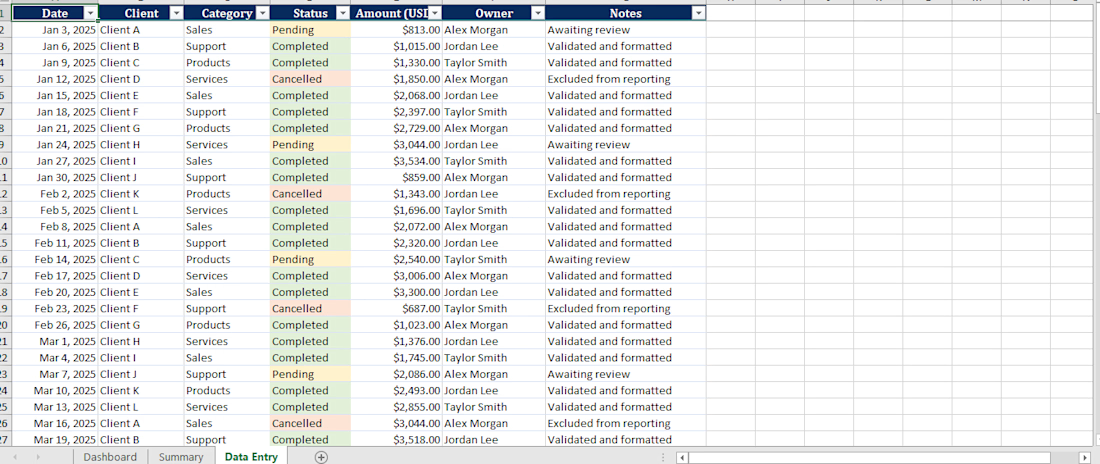
I engineered an end-to-end automated reporting dashboard natively inside Microsoft Excel. Using Power Query, I built an automated ETL data pipeline that instantly ingests, cleanses, and structures raw transaction files with a single click.
Key Features Implemented:
• Dynamic Executive KPI Cards tracking Total Revenue, OPEX, and Receivable Days.
• Interactive Slicer components allowing stakeholders to drill down by Year and Business Sector.
• High-contrast risk trend lines indicating next-month financial boundaries.
• 100% gridless, custom application UI layout for maximum visual clarity.
The Result:
Eliminated 5+ hours of manual data preparation per week, providing the finance director with real-time, zero-touch risk indicator metrics.

The network for creativity
Join 1.25M professional creatives like you
Connect with clients, get discovered, and run your business 100% commission-free
Creatives on Contra have earned over $150M and we are just getting started
Trending
retrofuturism
Share your favorite designs from the past exploring the distant future. Or your own take on the aesthetic 🚀
halftone
Dots. Texture. Grain. Let's see your designs using the halftone technique.

Midjourney
Creatives are showing off what they're making with Midjourney.
colorgrade
Video editors sound off: How do you enhance the mood of your video in color grading?





Related posts


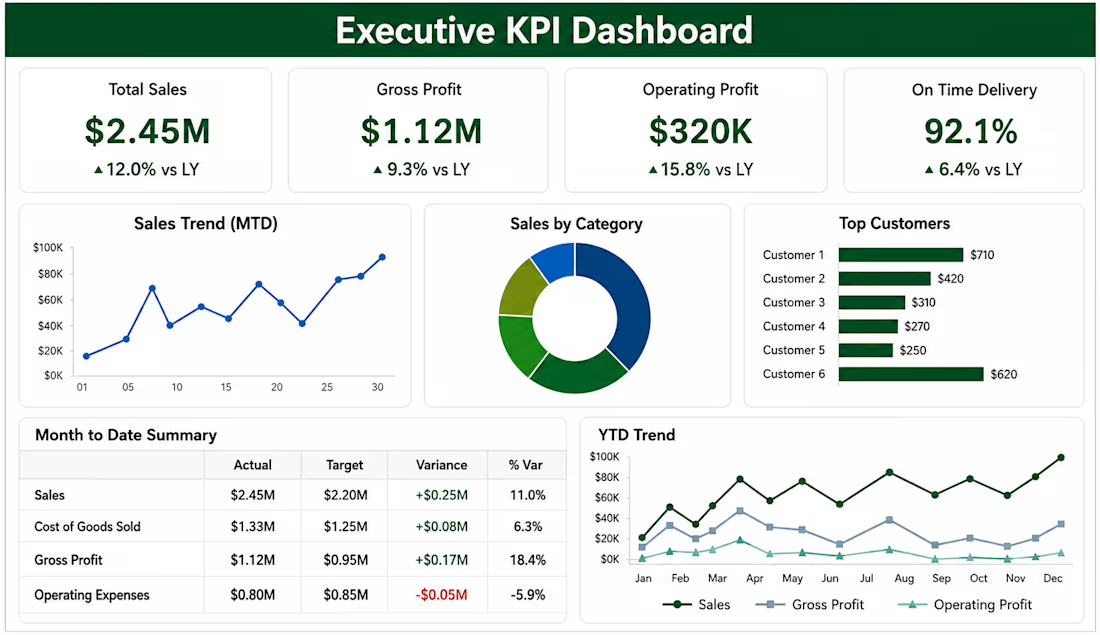
Built a dynamic Executive KPI Dashboard in Excel to turn raw business data into clear, decision-ready insights. The dashboard highlights key metrics such as sales, gross profit, operating profit, on-time delivery, customer performance, monthly trends, and variance to target.
Designed for quick executive review, the dashboard helps users spot performance changes, identify problem areas, and track progress without digging through large spreadsheets or manual reports.
Key features:
KPI summary cards
Month-to-date performance
Actual vs. target variance
Customer performance analysis
Sales and profit trends
Clean executive-level reporting layout
Built to support repeatable reporting and easy data updates

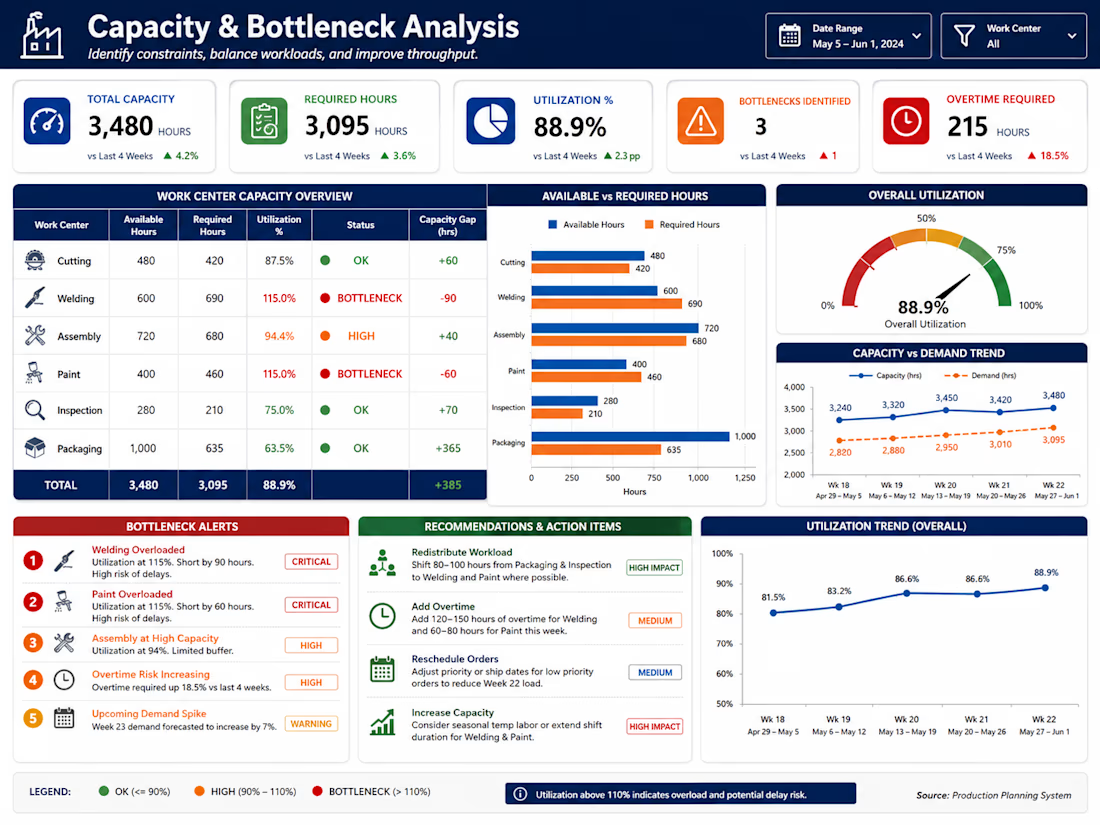
Built a Capacity & Bottleneck Analysis tool in Excel to help operations teams identify overloaded work centers, understand capacity gaps, and make better production planning decisions.
The analysis compares available capacity against required hours across each resource, highlights constraints before they impact output, and provides a clear view of where overtime, workload balancing, or schedule changes may be needed.
Key features:
Available vs. required capacity analysis
Work center utilization tracking
Capacity gap calculations
Bottleneck identification
Overtime requirement visibility
Capacity vs. demand trends
Utilization trend analysis
Risk-based alerts
Actionable planning recommendations
Management-ready summary dashboard
Designed to help planners quickly identify where capacity is constrained, understand the size of the gap, and determine where resources or schedules may need to be adjusted.