
Jacob Linker
Excel & VBA Automation for Smarter Business Operations.
New to Contra
Jacob is building their profile!
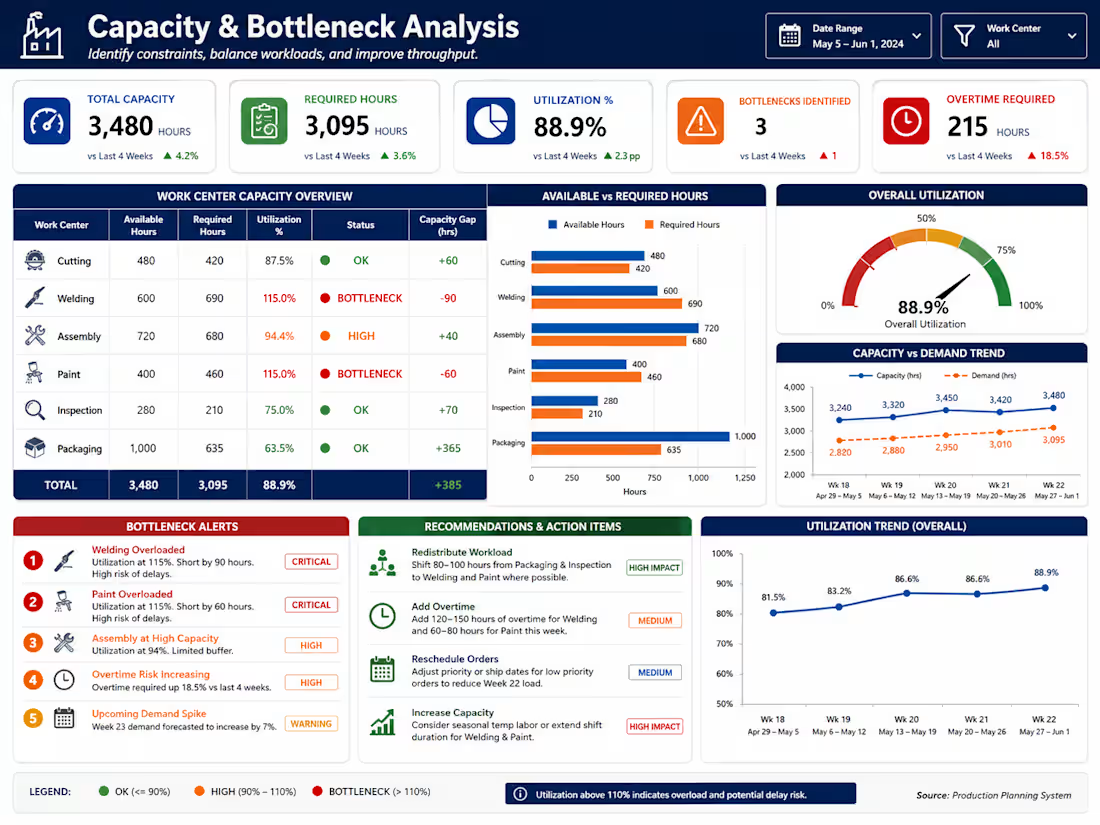
Built a Capacity & Bottleneck Analysis tool in Excel to help operations teams identify overloaded work centers, understand capacity gaps, and make better production planning decisions.
The analysis compares available capacity against required hours across each resource, highlights constraints before they impact output, and provides a clear view of where overtime, workload balancing, or schedule changes may be needed.
Key features:
Available vs. required capacity analysis
Work center utilization tracking
Capacity gap calculations
Bottleneck identification
Overtime requirement visibility
Capacity vs. demand trends
Utilization trend analysis
Risk-based alerts
Actionable planning recommendations
Management-ready summary dashboard
Designed to help planners quickly identify where capacity is constrained, understand the size of the gap, and determine where resources or schedules may need to be adjusted.
2
20
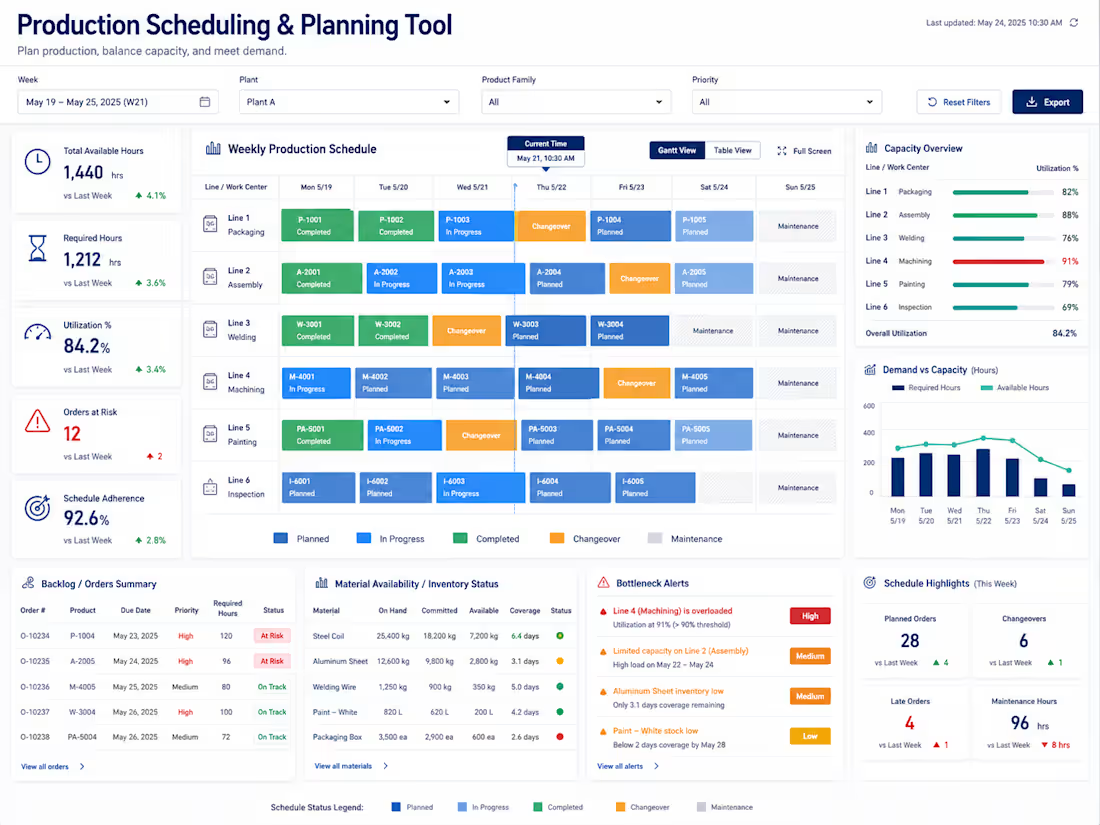
Built a robust Production Scheduling & Planning Tool in Excel to help manufacturing teams balance demand, capacity, material availability, and production priorities in one place.
The tool provides a clear weekly production schedule across multiple lines or work centers, while also highlighting capacity constraints, late orders, material risks, maintenance windows, and schedule adherence.
Key features:
Multi-line production scheduling
Weekly Gantt-style schedule view
Capacity and utilization tracking
Demand vs. available hours analysis
Backlog and order prioritization
Material availability monitoring
Bottleneck and overload alerts
Changeover and maintenance visibility
Schedule adherence tracking
At-risk order identification
Production KPI summaries
Management-ready planning dashboard
Designed to help planners quickly see where the schedule is overloaded, which orders are at risk, and what operational issues need attention before they impact production.
1
22
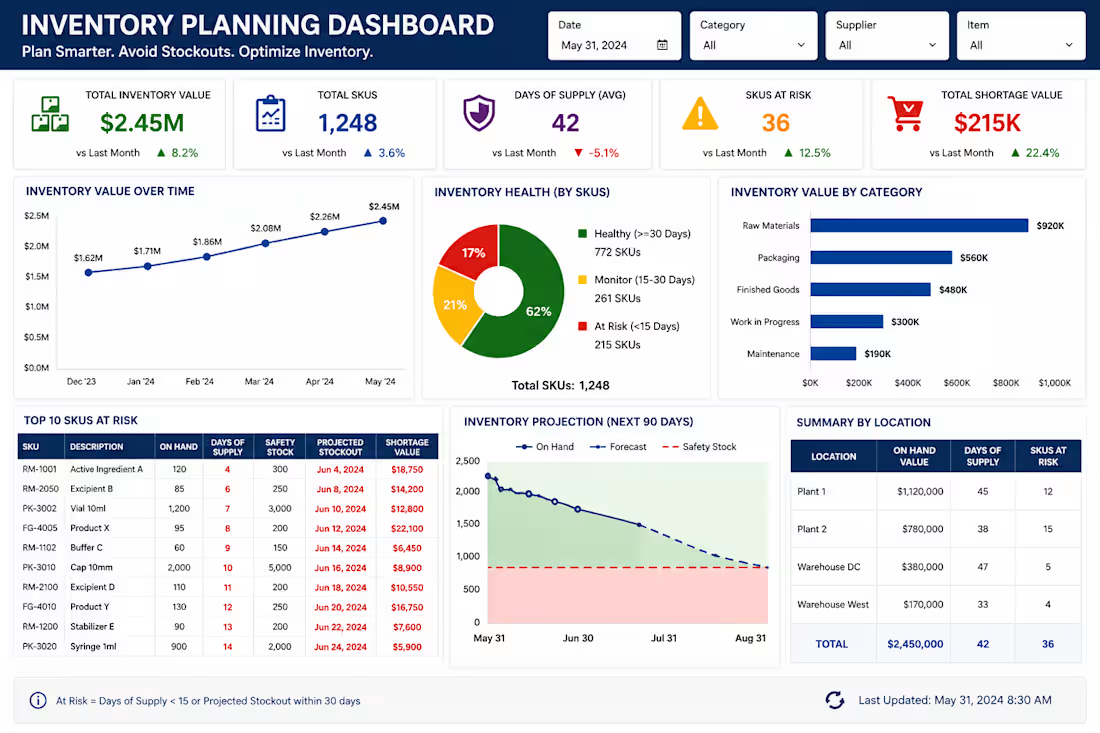
Built a dynamic Inventory Planning Dashboard in Excel to help businesses monitor stock levels, identify shortage risks, and make better replenishment decisions.
The dashboard combines inventory value, days of supply, safety stock, projected stockouts, and at-risk SKUs into one clear planning view. It is designed to help users quickly understand where inventory is healthy, where attention is needed, and which materials may create future supply issues.
Key features:
Inventory value and SKU tracking
Days of supply analysis
Safety stock monitoring
Projected stockout dates
At-risk inventory identification
Inventory health by category
90-day inventory projections
Location-level inventory summaries
Shortage value tracking
Management-ready dashboard layout
1
26
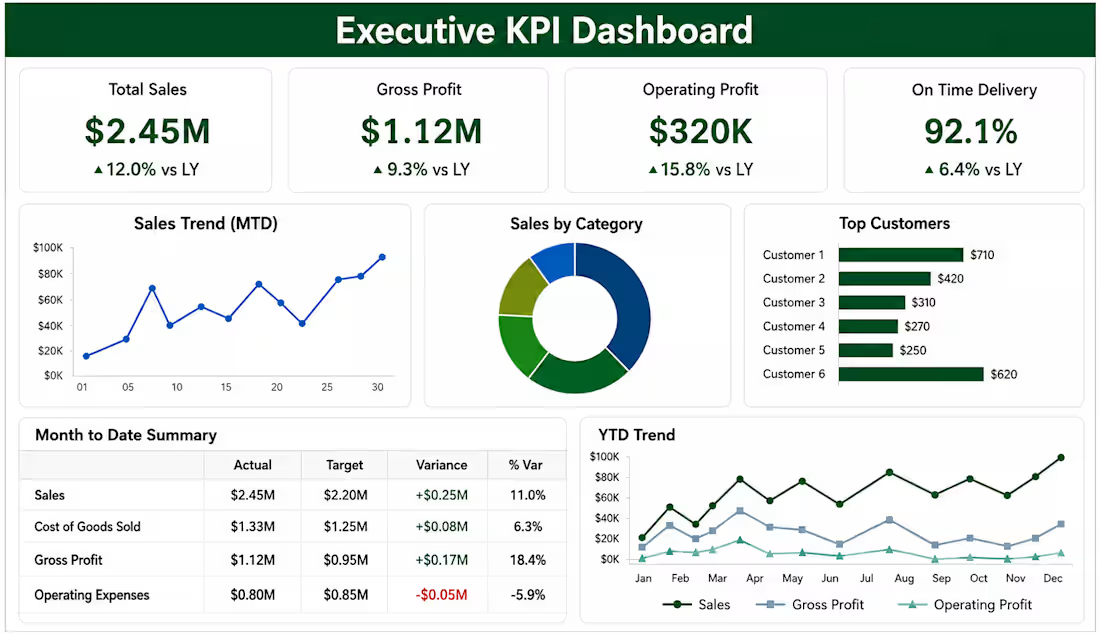
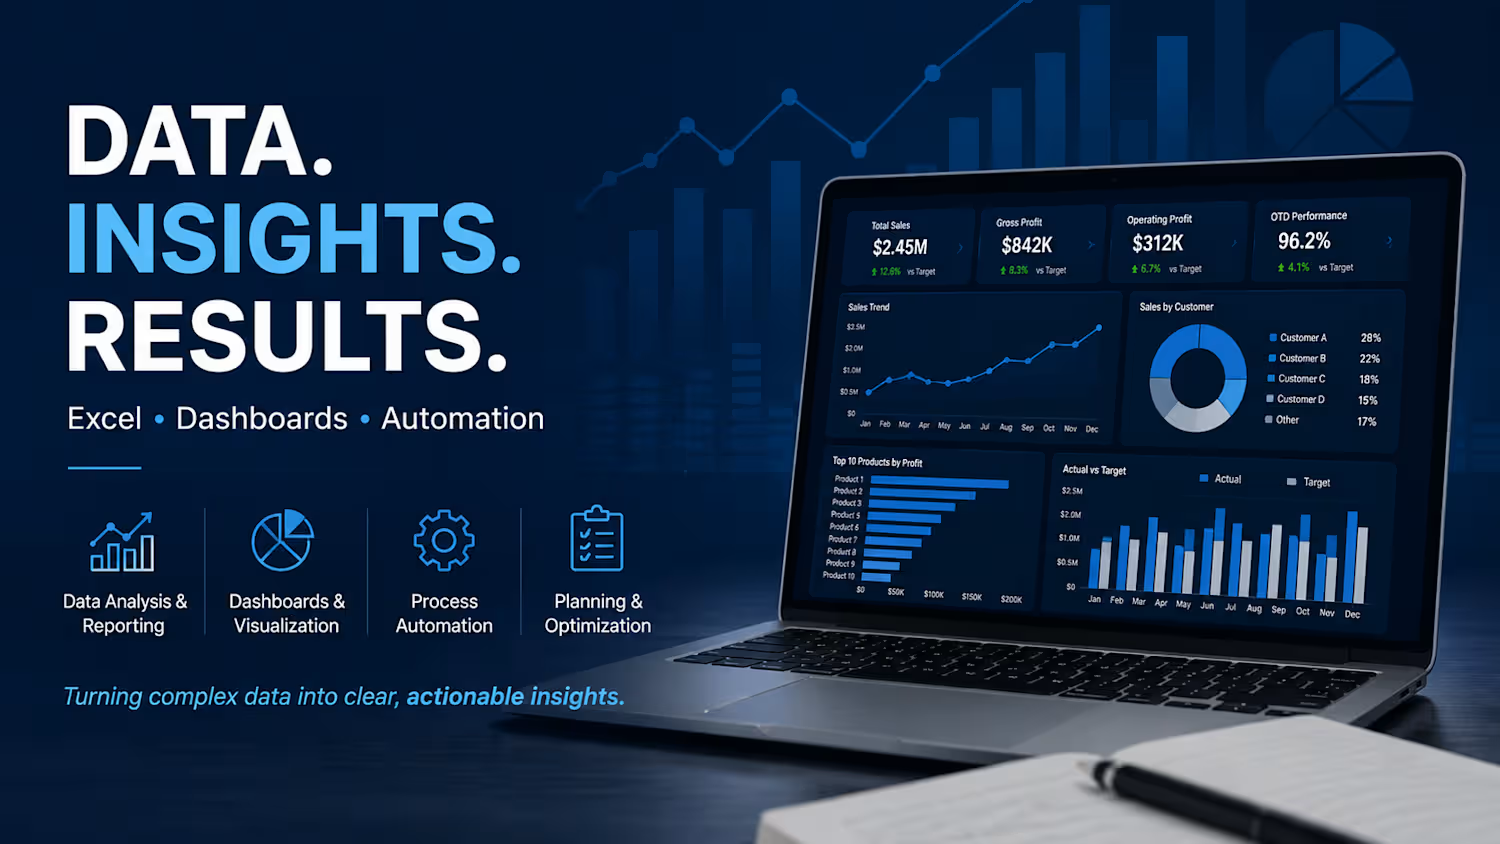
Built a dynamic Executive KPI Dashboard in Excel to turn raw business data into clear, decision-ready insights. The dashboard highlights key metrics such as sales, gross profit, operating profit, on-time delivery, customer performance, monthly trends, and variance to target.
Designed for quick executive review, the dashboard helps users spot performance changes, identify problem areas, and track progress without digging through large spreadsheets or manual reports.
Key features:
KPI summary cards
Month-to-date performance
Actual vs. target variance
Customer performance analysis
Sales and profit trends
Clean executive-level reporting layout
Built to support repeatable reporting and easy data updates
1
40