The network for creativity
Join 1.25M professional creatives like you
Connect with clients, get discovered, and run your business 100% commission-free
Creatives on Contra have earned over $150M and we are just getting started
Back to feedPost

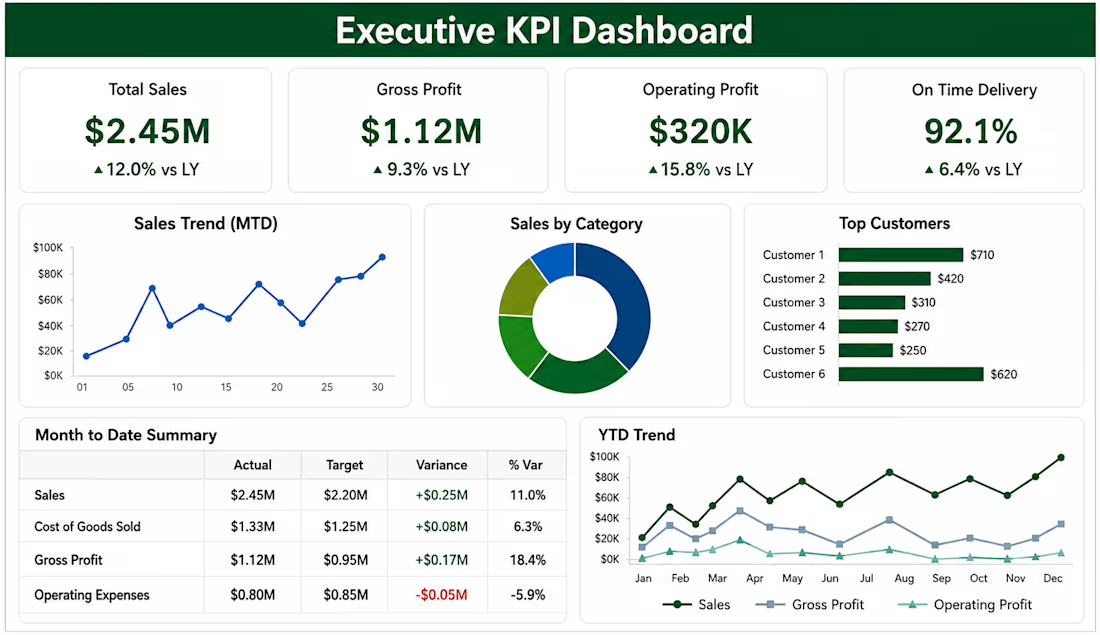
Built a dynamic Executive KPI Dashboard in Excel to turn raw business data into clear, decision-ready insights. The dashboard highlights key metrics such as sales, gross profit, operating profit, on-time delivery, customer performance, monthly trends, and variance to target.
Designed for quick executive review, the dashboard helps users spot performance changes, identify problem areas, and track progress without digging through large spreadsheets or manual reports.
Key features:
KPI summary cards
Month-to-date performance
Actual vs. target variance
Customer performance analysis
Sales and profit trends
Clean executive-level reporting layout
Built to support repeatable reporting and easy data updates


The network for creativity
Join 1.25M professional creatives like you
Connect with clients, get discovered, and run your business 100% commission-free
Creatives on Contra have earned over $150M and we are just getting started
Trending
retrofuturism
Share your favorite designs from the past exploring the distant future. Or your own take on the aesthetic 🚀
halftone
Dots. Texture. Grain. Let's see your designs using the halftone technique.

Midjourney
Creatives are showing off what they're making with Midjourney.
colorgrade
Video editors sound off: How do you enhance the mood of your video in color grading?


Related posts

Designing a dashboard that turns complex workforce data into clear, actionable insights.
Focused on making attendance, shifts, working hours, and key metrics easier to understand at a glance.
#ProductDesign #UXDesign #DashboardDesign #UIUX #SaaS #Figma
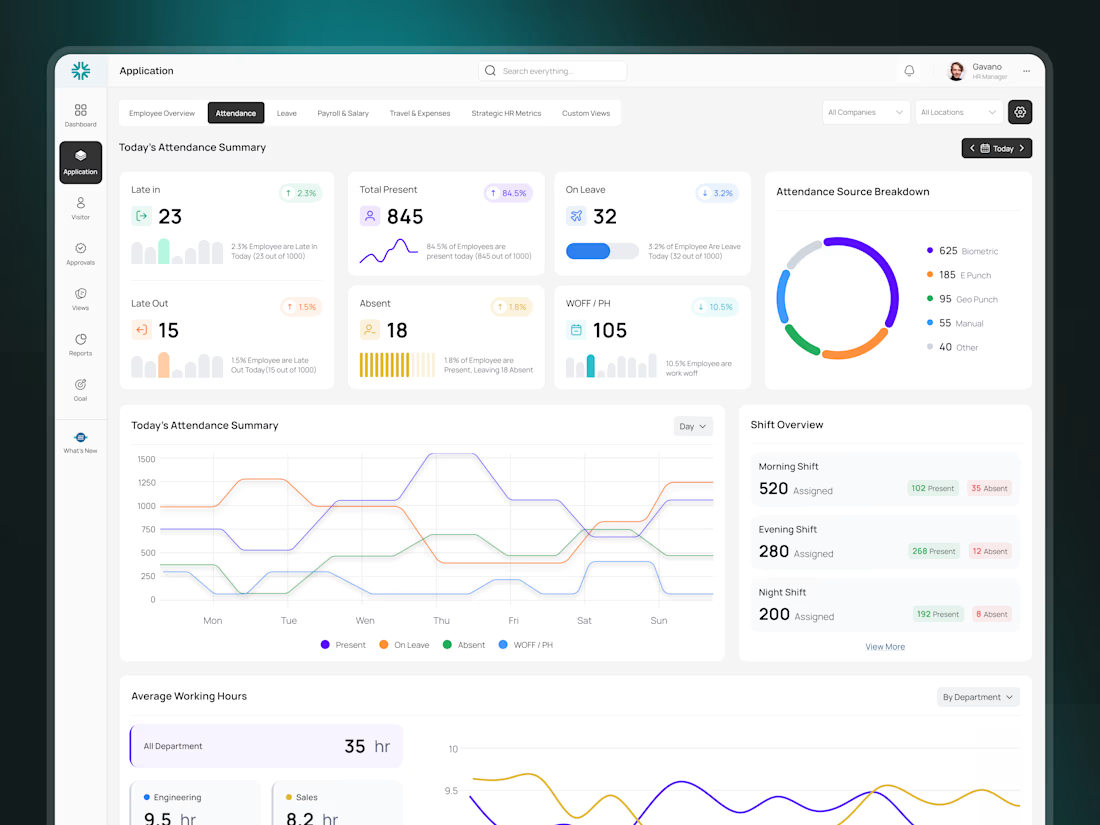

The multi-line shift chart earns its space by showing morning/evening/night as separate trends instead of one blended attendance number — that's the difference between "who's late today" and "which shift is actually understaffed." The KPI row above stays honest by not trying to say the same thing twice.

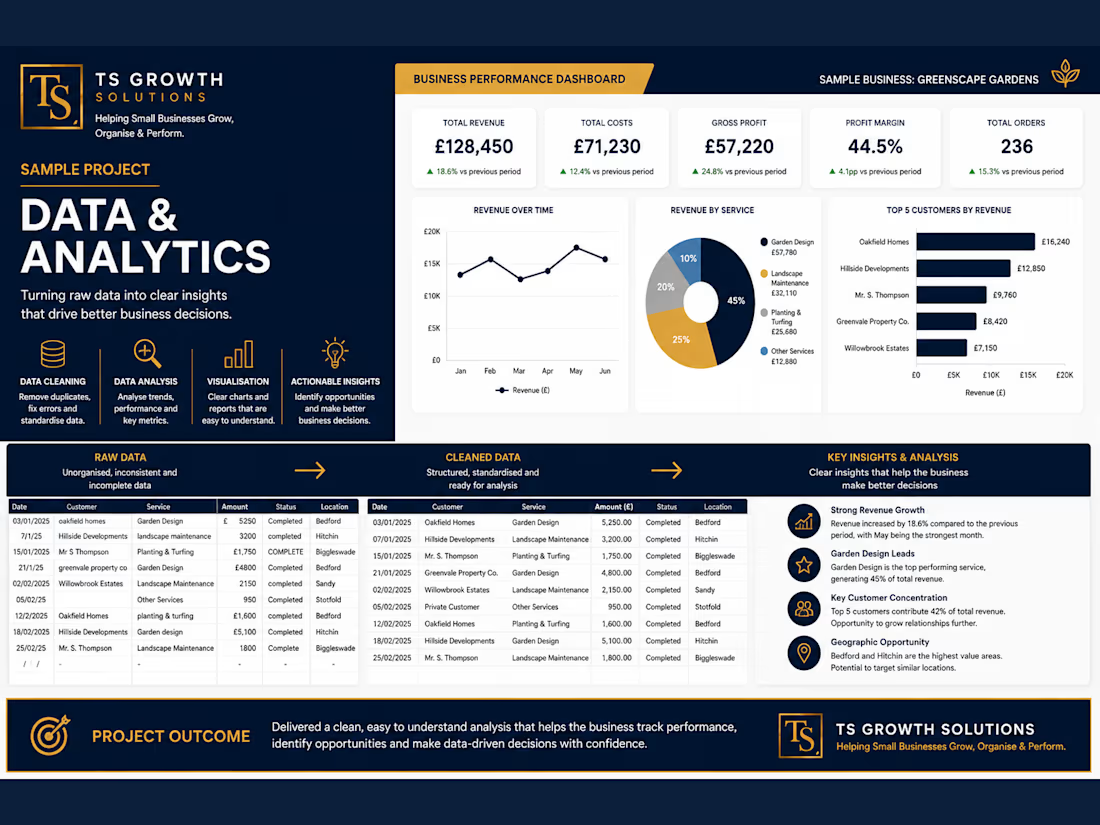
This sample demonstrates how I can take business data, organise and analyse it, and turn it into clear information that can support better business decisions.
The project includes data cleaning, spreadsheet analysis, KPI reporting, revenue and profit analysis, trend analysis and data visualisation.
The aim is to make business data easier to understand and highlight the areas that may require attention.
Work demonstrated:
Data cleaning and organisation
Spreadsheet analysis
KPI reporting
Revenue and profit analysis
Trend analysis
Data visualisation
Business insights
Note: All data used in this project is fictional and was created specifically for portfolio demonstration purposes. No client results are being claimed.


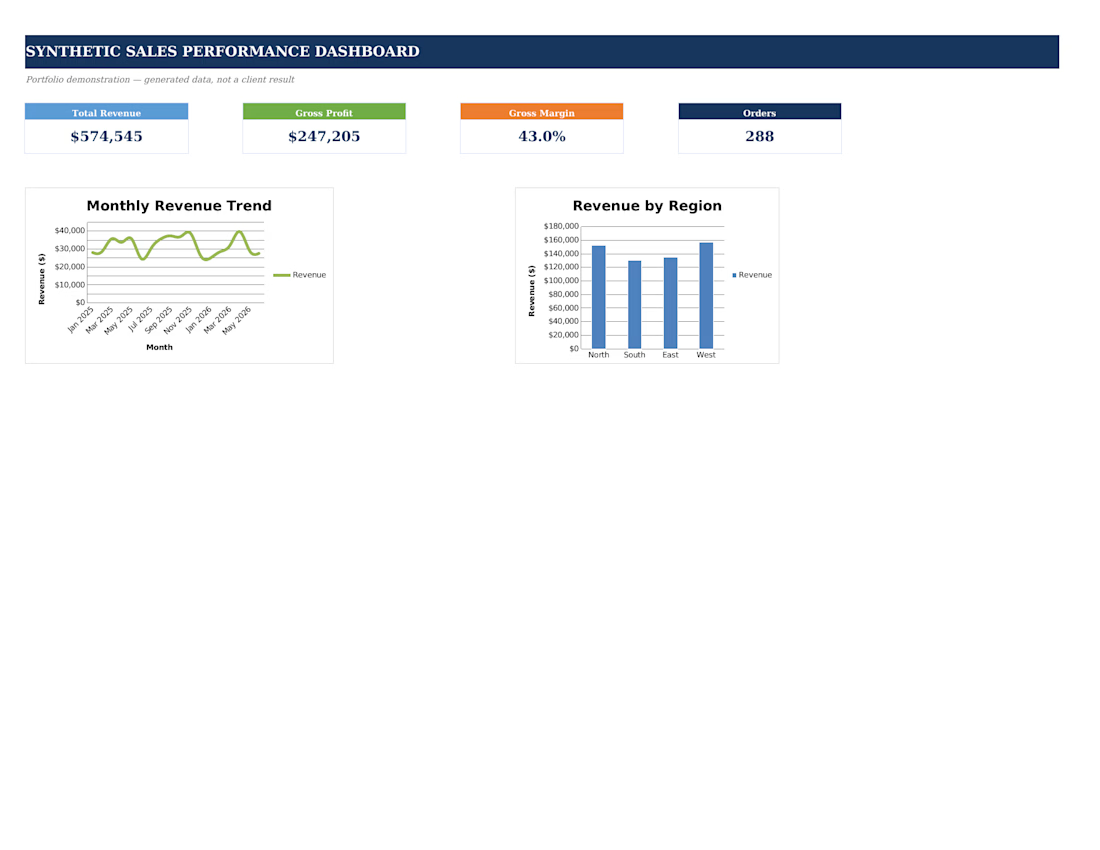
Synthetic Sales P
erformance Dashboard
A portfolio demonstration built with 288 deterministic synthetic sales records. The workbook separates raw data, monthly and regional summaries, KPI formulas, conditional formatting, and charts, with QA and disclosure notes. It is not client work or a client result. Built to demonstrate transparent Excel reporting and a maintainable handoff.