
Vishal Bharawan
Business Intelligence Specialist | Power BI, SQL & Excel Aut
New to Contra
Vishal is building their profile!

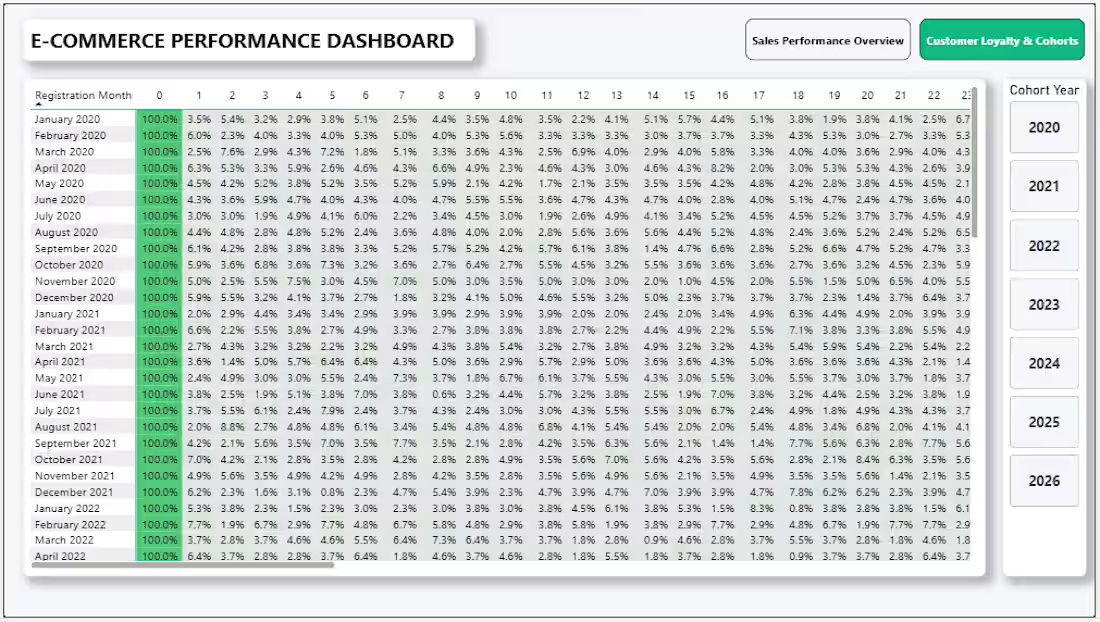
Are you drowning in data but starving for insights?
Most businesses have thousands of rows of data sitting unused. I specialize in turning that messy data into interactive, boardroom-ready Power BI dashboards that actually drive revenue.
Stop guessing if your marketing is working or if your customers are returning. Get a clear, automated view of your business.
WHAT I WILL DO FOR YOU:
🔹 Connect your raw data (Excel, CSV, SQL, Web) to Power BI.
🔹 Clean and structure the data (Star Schema, Power Query).
🔹 Write advanced DAX formulas (Customer Lifetime Value, YoY Growth, Cohort Analytics).
🔹 Build highly visual, interactive dashboards with custom filters and drill-down tooltips.
MY EXPERTISE INCLUDES:
✔️ E-Commerce (Retention, Sales Funnels, Cohorts)
✔️ Financial Modeling (Revenue Tracking, Runway)
✔️ Operations & Sales Pipelines
HOW IT WORKS:
Message me with a brief of your goals.
Send over a sample of your raw data.
I build a dashboard that updates automatically, saving you hours every week.
Let's automate your reporting. Click "Contact Seller" to get started!
0
17
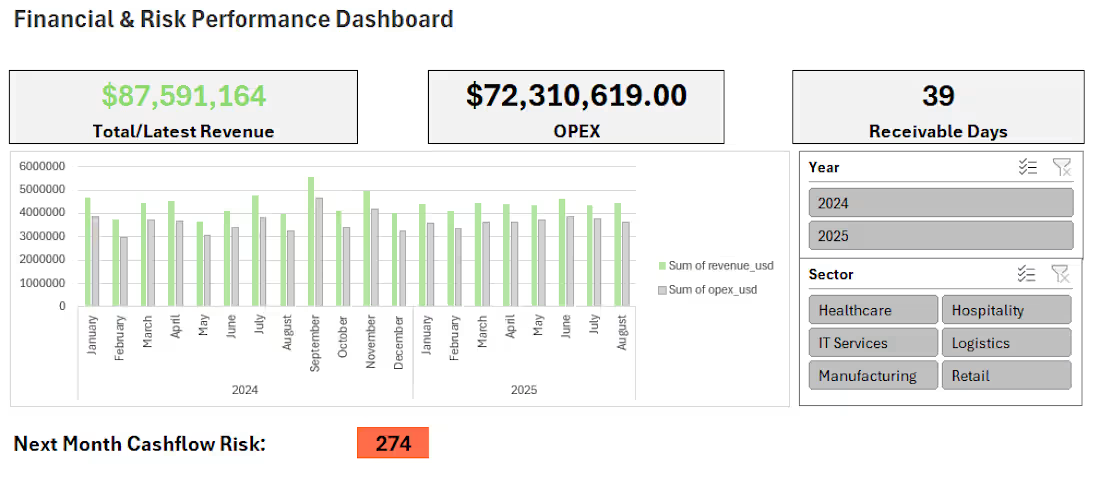
The Challenge:
An enterprise team was manually copying, pasting, and merging fragmented financial CSV files every week to track operational runway. This manual process led to syntax errors, broken formulas, and a total lack of forward-looking cash flow visibility for executives.
The Solution:
I engineered an end-to-end automated reporting dashboard natively inside Microsoft Excel. Using Power Query, I built an automated ETL data pipeline that instantly ingests, cleanses, and structures raw transaction files with a single click.
Key Features Implemented:
• Dynamic Executive KPI Cards tracking Total Revenue, OPEX, and Receivable Days.
• Interactive Slicer components allowing stakeholders to drill down by Year and Business Sector.
• High-contrast risk trend lines indicating next-month financial boundaries.
• 100% gridless, custom application UI layout for maximum visual clarity.
The Result:
Eliminated 5+ hours of manual data preparation per week, providing the finance director with real-time, zero-touch risk indicator metrics.
0
19