The network for creativity
Join 1.25M professional creatives like you
Connect with clients, get discovered, and run your business 100% commission-free
Creatives on Contra have earned over $150M and we are just getting started
Back to feedPost

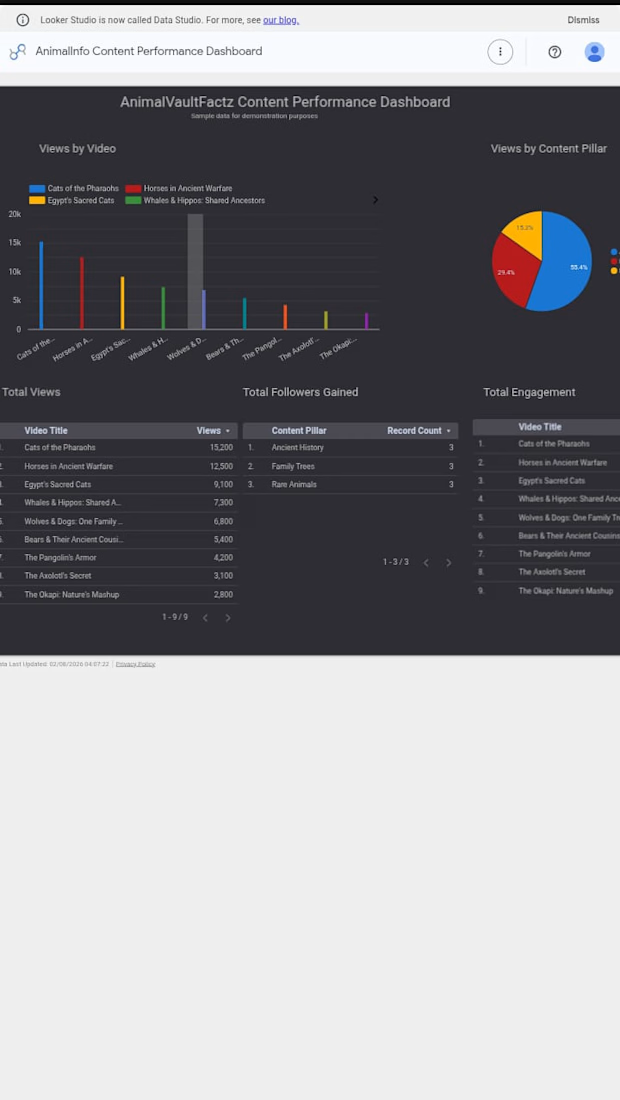
A content analytics dashboard built in Looker Studio, connected to Google Sheets, tracking views, engagement, and content-pillar performance at a glance for a short-form video brand.
The problem: raw platform analytics (TikTok, etc.) don't show performance broken down by content category — making it hard to see which content pillars are actually working without manually cross-referencing every post.
The build: at-a-glance scorecards for total views, total followers gained, and total engagement (likes + comments + shares), plus a breakdown of views by individual video and by content pillar (Rare Animals / Family Trees / Ancient History) — surfacing which content categories perform best.
Note: built using sample/demo data for demonstration purposes, not live account data. The dashboard structure, connections, and logic are fully functional and could be connected to real data at any time.
Result: a working, reusable reporting template — the kind of dashboard a content or marketing team would use to make decisions on what to produce more of.


The network for creativity
Join 1.25M professional creatives like you
Connect with clients, get discovered, and run your business 100% commission-free
Creatives on Contra have earned over $150M and we are just getting started

Challenges
View all


Related posts


The overall feel of the site is really amazing 🙌

Hey, it’s been a while!
This summer has been packed with client work, new projects, and a lot of conversations about how to build a business around what you know.
One thing I keep seeing: people are sold the idea that a course, digital product, or funnel will create “passive income.”
But the truth is a little more nuanced.
After working with 350+ course creators, I know that both service-based businesses and digital product businesses can be profitable, but they require very different things from you.
In my newest video, I break down:
☑️ The real math behind reaching $100K
☑️ How much of your time goes into what
☑️ What it takes to scale each model
☑️ How to decide which path fits you
Watch the full breakdown here 👇
https://youtu.be/qUaF1M7Bfyg