The network for creativity
Join 1.25M professional creatives like you
Connect with clients, get discovered, and run your business 100% commission-free
Creatives on Contra have earned over $150M and we are just getting started
Back to feedPost

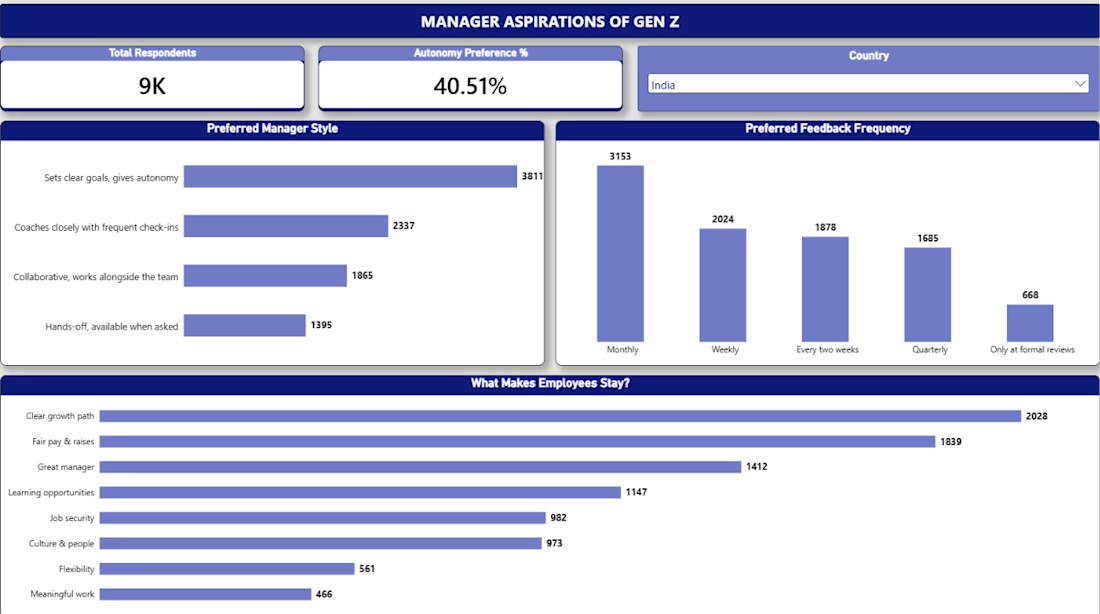
📊 Power BI Dashboard – Manager Aspirations
As part of my Gen Z Career Aspirations Analytics project, I developed an interactive Power BI dashboard focused on understanding Gen Z's expectations and aspirations from managers.
Key highlights:
Manager expectations and preferences
Important workplace factors
Interactive charts and visualizations
Data-driven insights
Tools Used: Microsoft Power BI, Excel
This project helped me improve my data visualization, analytical thinking, and dashboard development skills.
#PowerBI #DataAnalytics #DataVisualization #DashboardDevelopment #BusinessIntelligence

The network for creativity
Join 1.25M professional creatives like you
Connect with clients, get discovered, and run your business 100% commission-free
Creatives on Contra have earned over $150M and we are just getting started



Related posts

Crypto Portfolio Dashboard
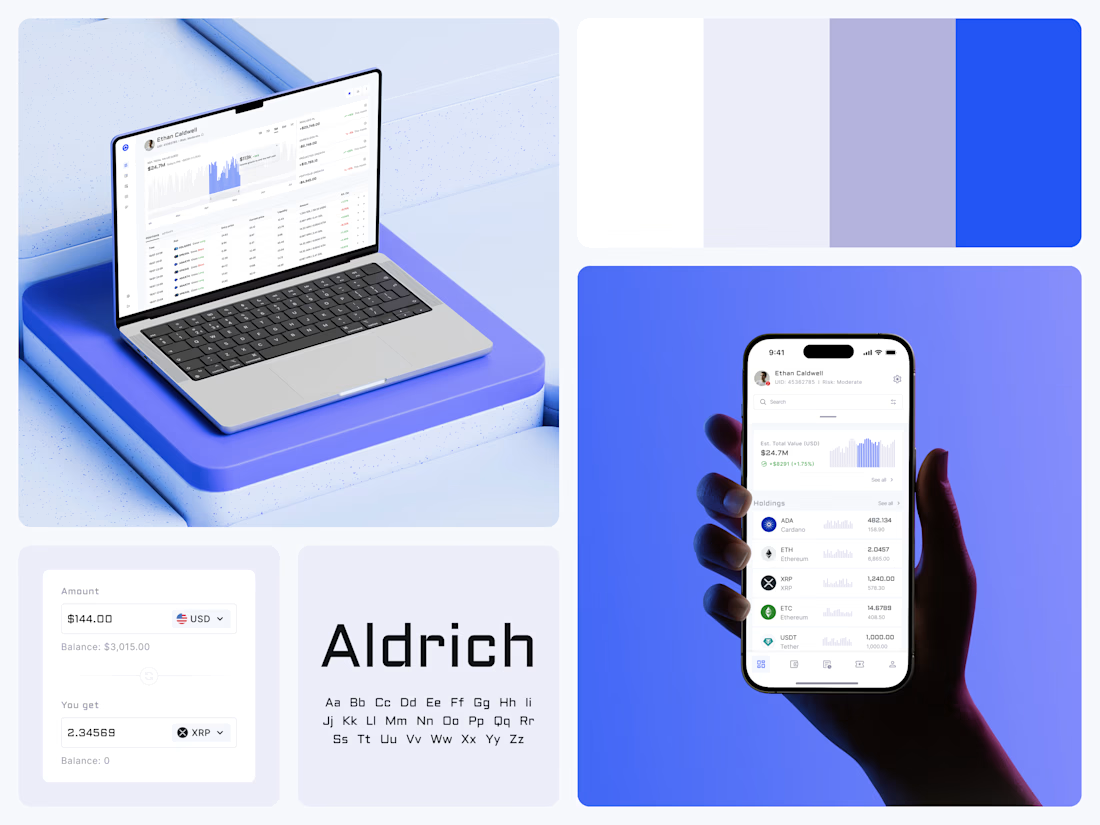
Blue means one thing here: the range you are looking at.
The value chart is a row of thin gray bars, and only the selected date range fills in blue. You read the period that matters and keep the months around it as context.
The phone carries the same chart above the holdings list. Each coin gets its own small bar chart between the name and the amount, so you can scan the whole portfolio for movement without opening a single coin.
Trading screens get busy fast. This one stays light and calm, so the numbers lead: total value, realized and unrealized P&L and open positions, all on one screen.
Designed by the Hue & Machine team.
#Crypto #Fintech #DashboardDesign #TradingPlatform #DataVisualization #UIDesign #ProductDesign #WebApp #MobileDesign #FigmaDesign



Nice Ui Dmytro

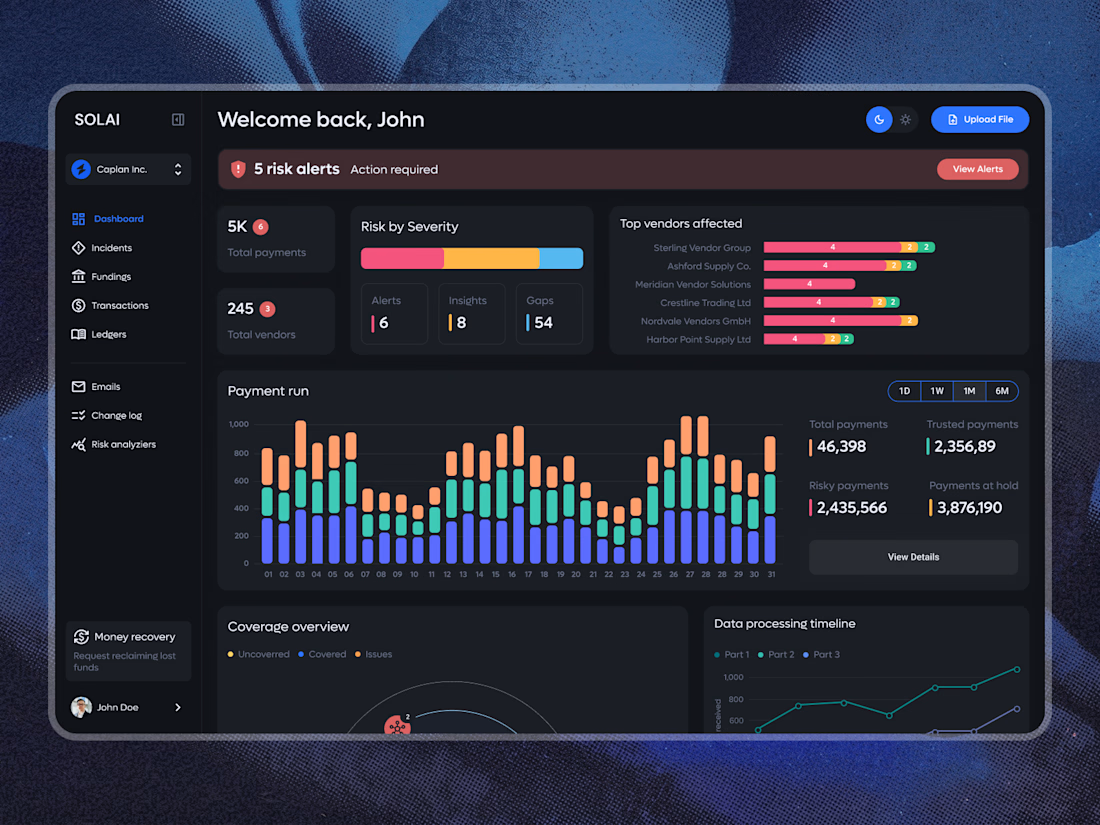
A dashboard with a lot of data doesn’t have to feel overwhelming.
The focus here was on clear hierarchy, easy-to-scan risk alerts, and making complex payment data feel simple and intuitive. Dark UI, structured analytics, and just enough color to guide attention where it matters.
What do you think of this direction?

Looks so clean! Love it 👏

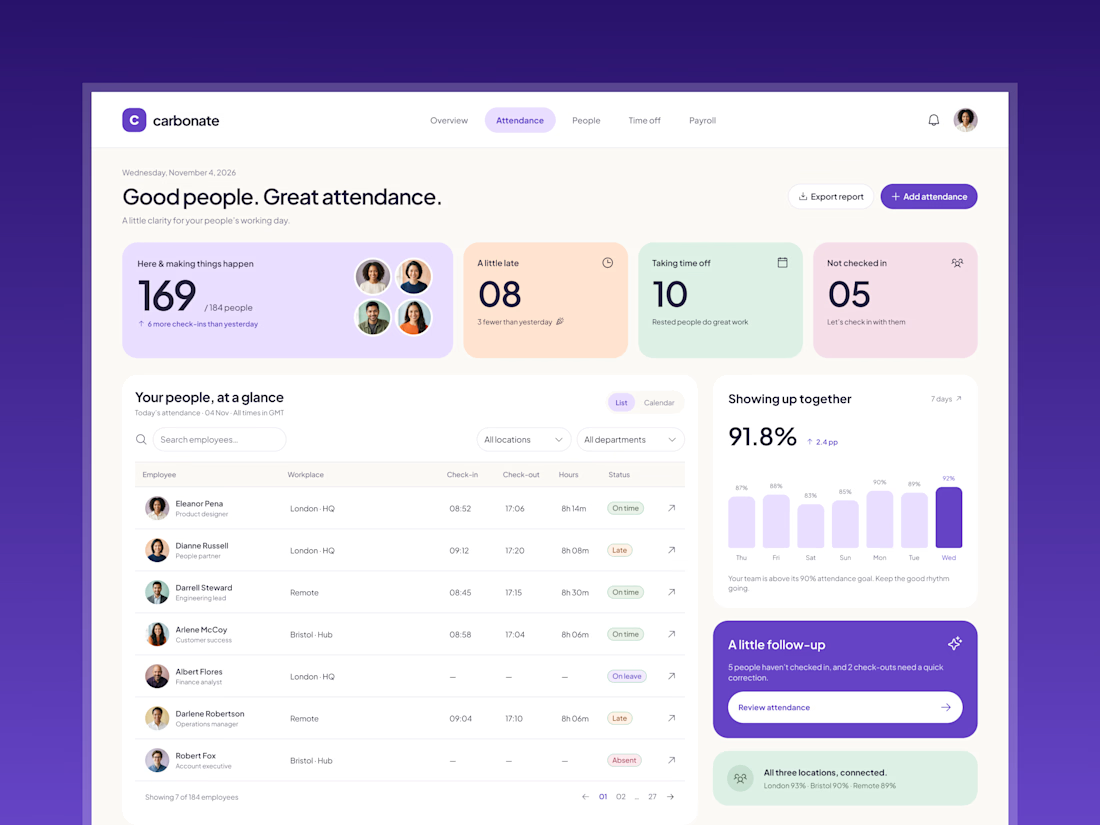
Redesign concept for Carbonate, where I designed a few screens early in my career. The dashboard helps HR teams see the day at a glance and know who to follow up with. It isn't the live product.
What I worked on:
- Dashboard layout: daily metrics, people table, weekly trend and follow-up card
- UX copy that keeps the tone human, like "Let's check in with them"
- Component-based UI in Figma, with one consistent icon set across the screen

These pastel cards work so well.