The network for creativity
Join 1.25M professional creatives like you
Connect with clients, get discovered, and run your business 100% commission-free
Creatives on Contra have earned over $150M and we are just getting started
Back to feedPost
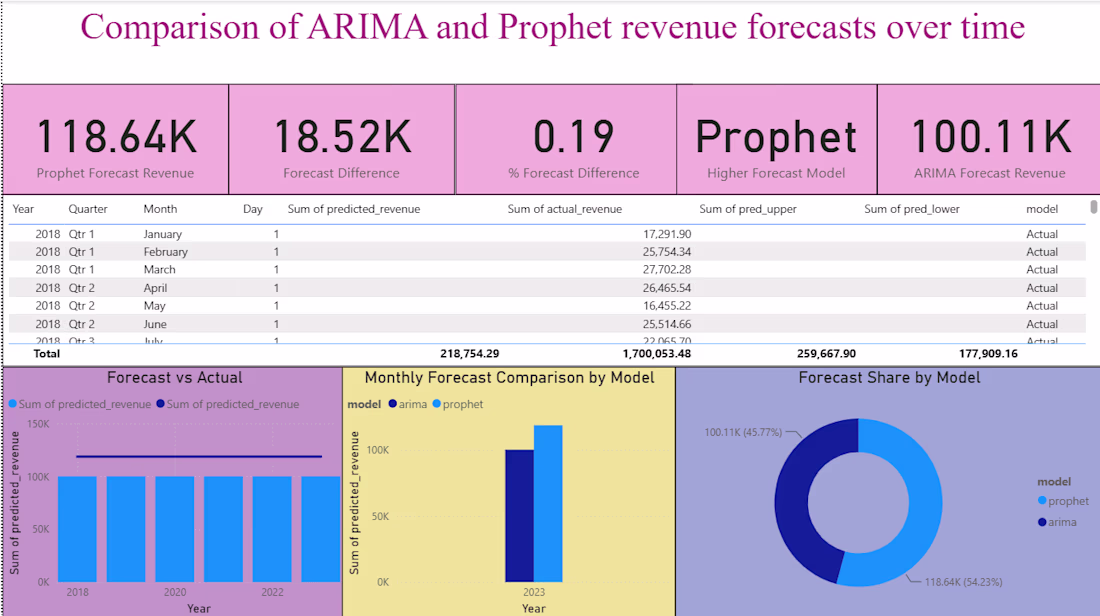
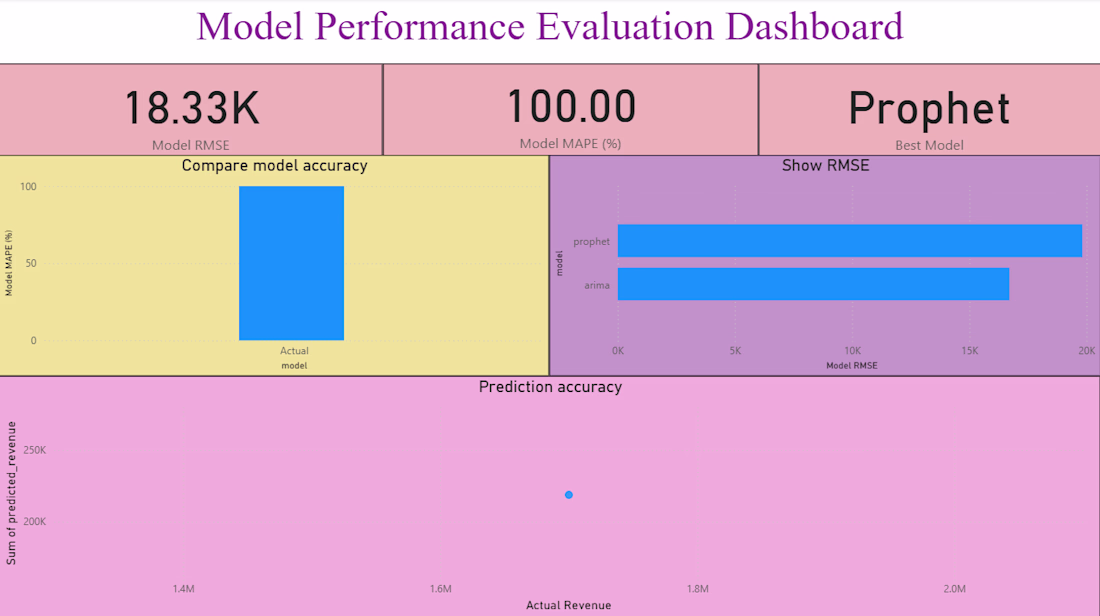
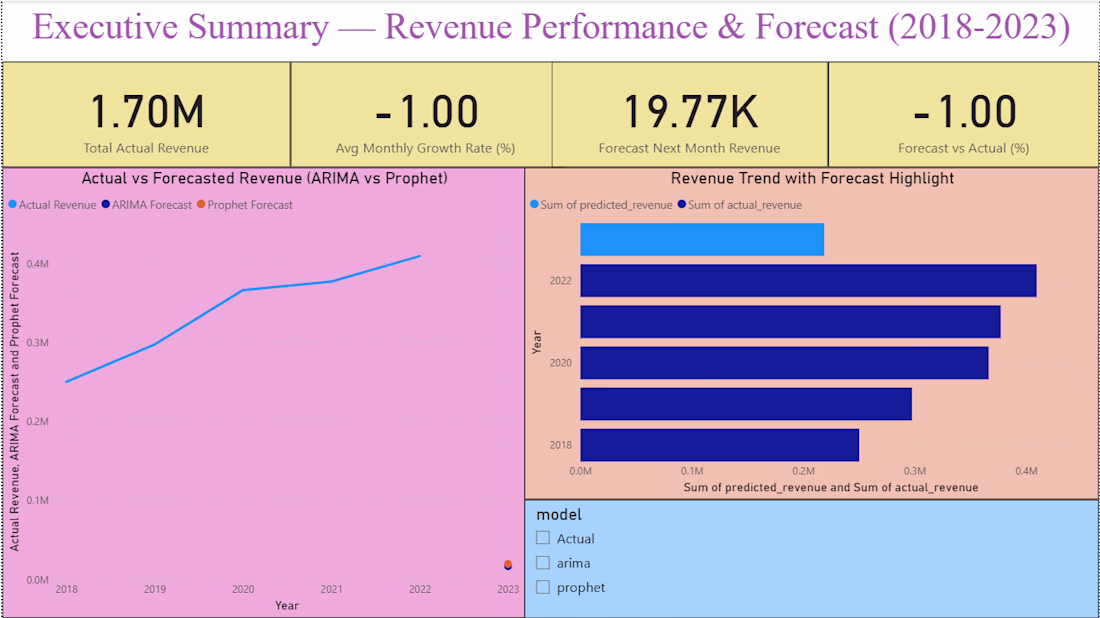
Developed an interactive Power BI dashboard to monitor financial performance, track key business KPIs, and support data-driven forecasting. The project transformed raw financial data into meaningful insights, enabling stakeholders to analyze trends, compare performance, and make informed strategic decisions.
✨ Key Highlights
📈 Financial Forecasting & Trend Analysis
🎯 KPI Tracking & Performance Monitoring
📊 Interactive Power BI Dashboard
🧹 Data Cleaning & Transformation
💰 Revenue, Profit & Expense Analysis
📅 Time-Series & Variance Analysis
💡 Executive Insights for Better Decision-Making
The network for creativity
Join 1.25M professional creatives like you
Connect with clients, get discovered, and run your business 100% commission-free
Creatives on Contra have earned over $150M and we are just getting started
Related posts
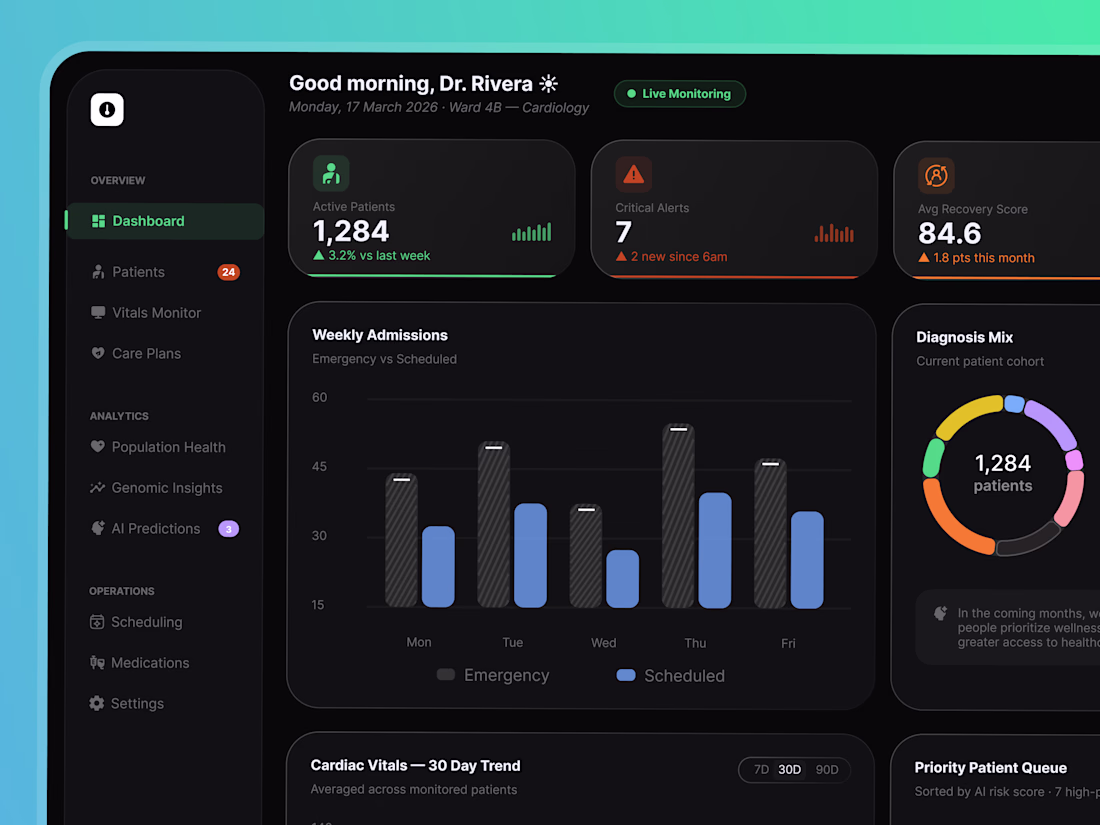
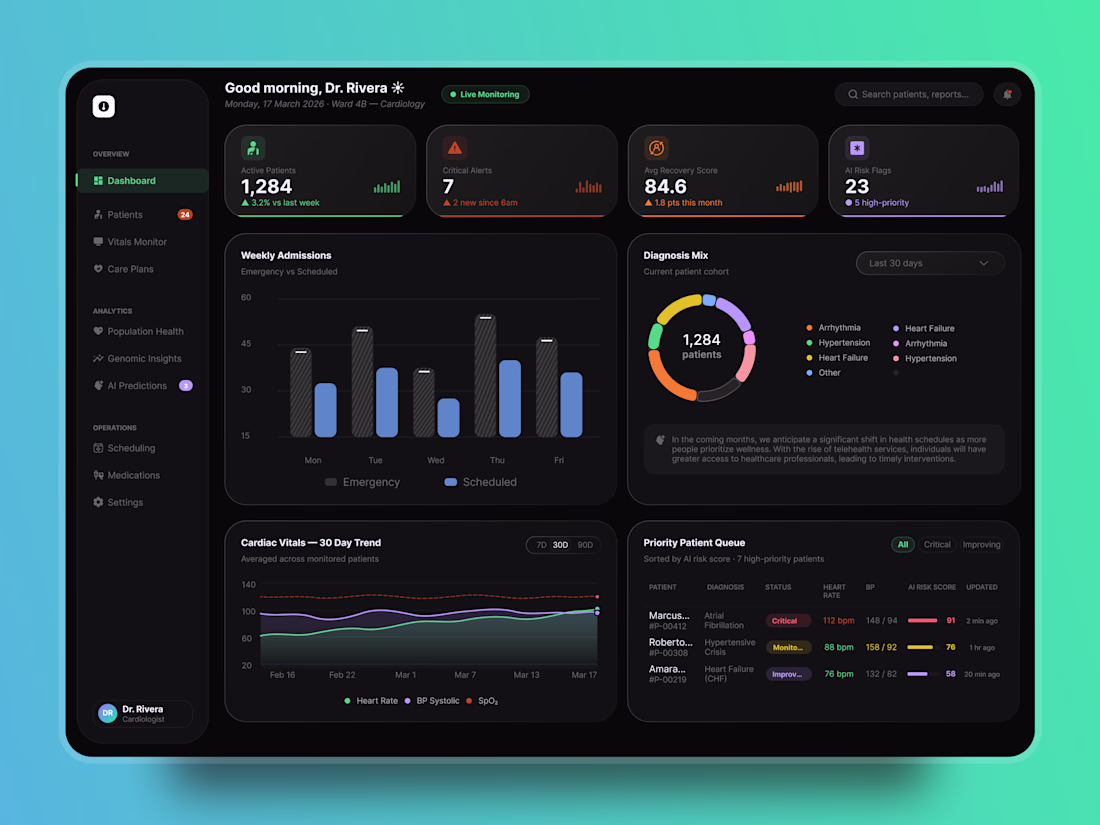
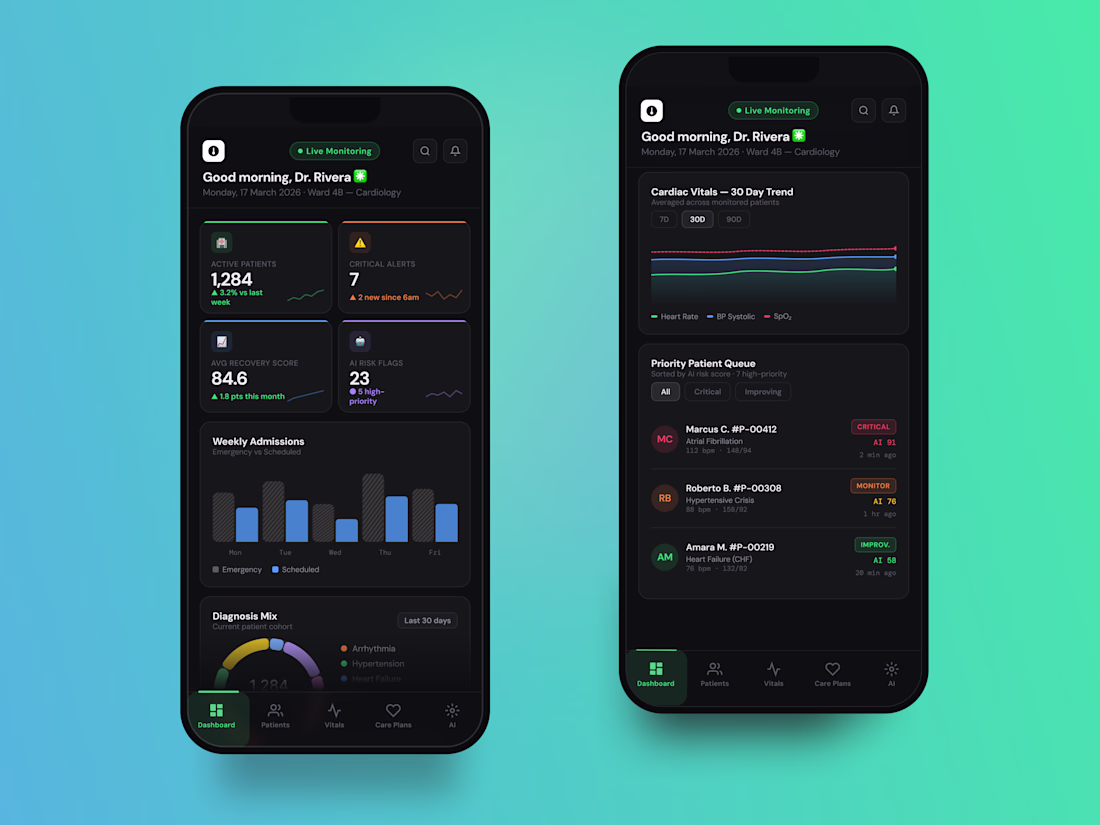
Vitara — AI-Powered Cardiology Dashboard for Healthcare Professionals 🩺
We designed a clean and data-rich dashboard for Vitara — an AI-assisted patient monitoring platform built for cardiologists managing high volumes of patients in real time.
🧩 The design uses a dark, clinical interface that keeps focus on the data: live vitals, AI risk scores, and patient queues are surfaced through clear charts and color-coded status indicators, making critical information instantly scannable during busy ward rounds.
Special attention was given to:
• at-a-glance KPI cards for active patients, critical alerts, and recovery scores;
• weekly admissions and 30-day cardiac vitals trend charts;
• AI-driven diagnosis mix breakdown and priority patient queue with risk scoring;
• fully responsive mobile dashboard with bottom navigation for on-the-go access;
• consistent dark UI system optimised for long monitoring sessions.
A precise and trustworthy digital experience that helps medical teams cut through data noise and act on what matters most — designed to support faster, smarter clinical decisions.
Looking to design a data-heavy dashboard that's both powerful and easy to read? Let's build something impactful together!🙌
🌱 Smart Farming Dashboard, designed to grow results.
-> Real-time field intelligence metrics
-> Optimal planting condition tracker
-> Live sensor monitoring across zones
-> 24-hour weather trend insights
-> AI-powered yield predictions
Clean. Smart. Built for farmers who think ahead. 🚜
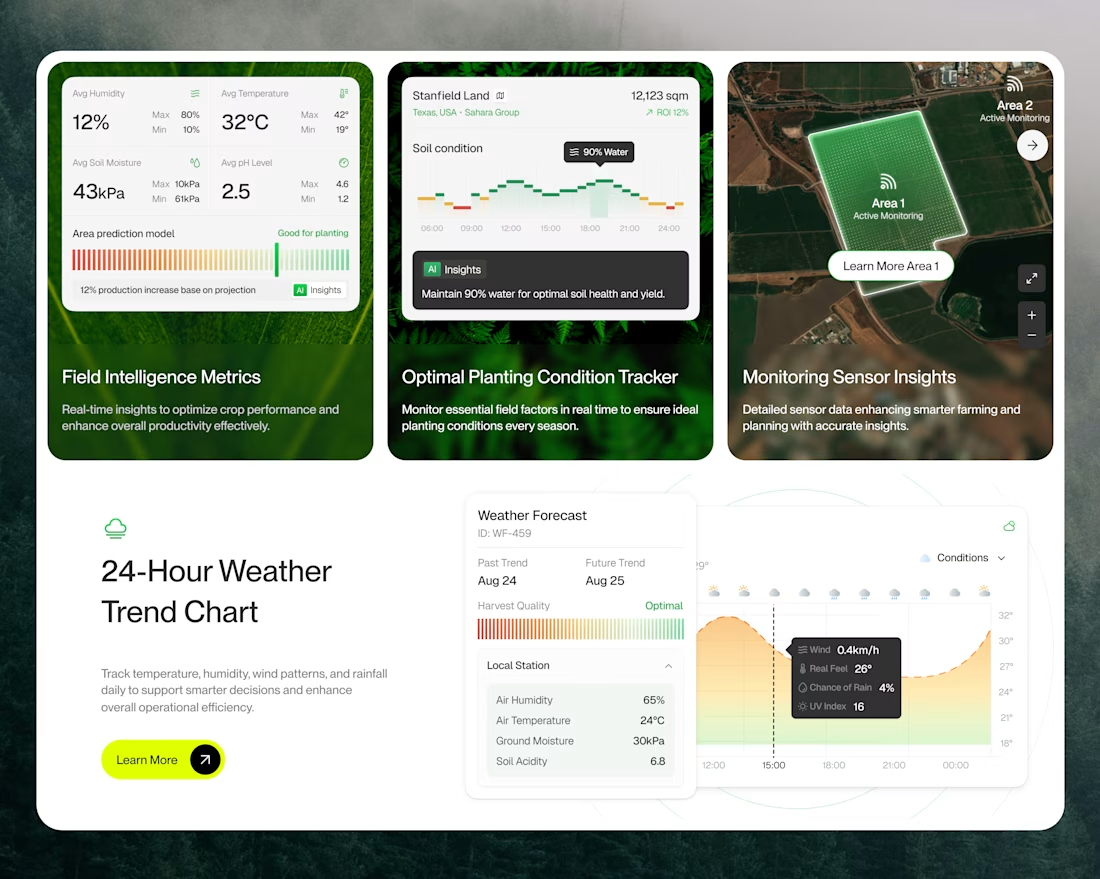
Smart use of data + agriculture.
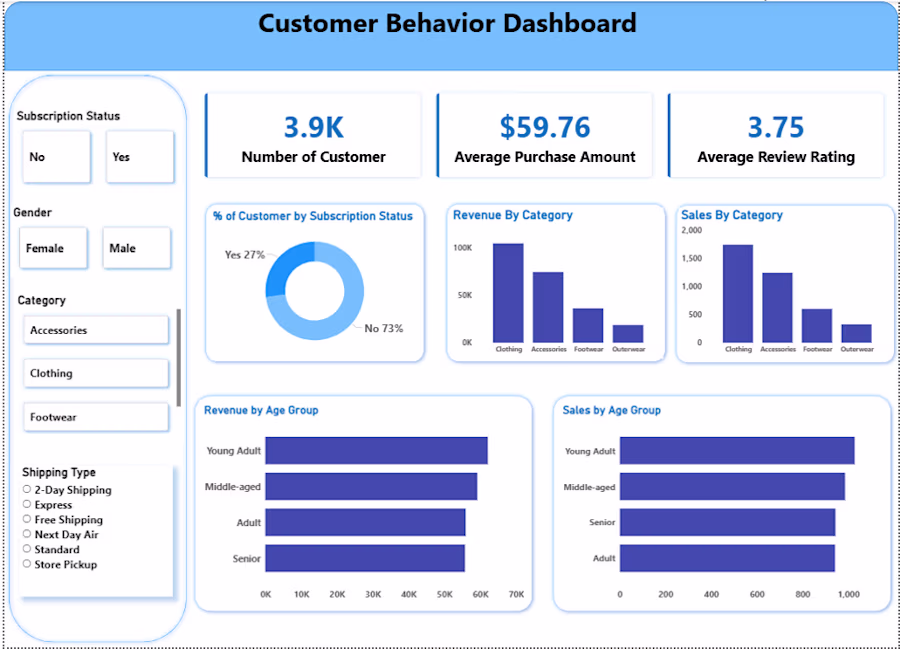
Built a Customer Behavior Dashboard analyzing 3.9K customers, tracking average purchase amount, review ratings, revenue by category, and sales by age group. Created using Power BI with interactive filters for gender, category, and shipping type. This project demonstrates end-to-end data analytics from raw data to business insights.
Trending
Claude
Claude has entered the design space. How are you using Claude Design?
Contra University
Learn from expert creatives how to earn more using next-gen AI tools.
MagicPath
The canvas is infinite, and exploration is becoming the workflow. How are you using MagicPath?
creativeaiflow
Creative AI workflows are evolving. What tools do you use, and what are their strengths and weaknesses?
freelancerlife
Freelancer life is wins, pivots, and everything in between. What’s yours right now?