
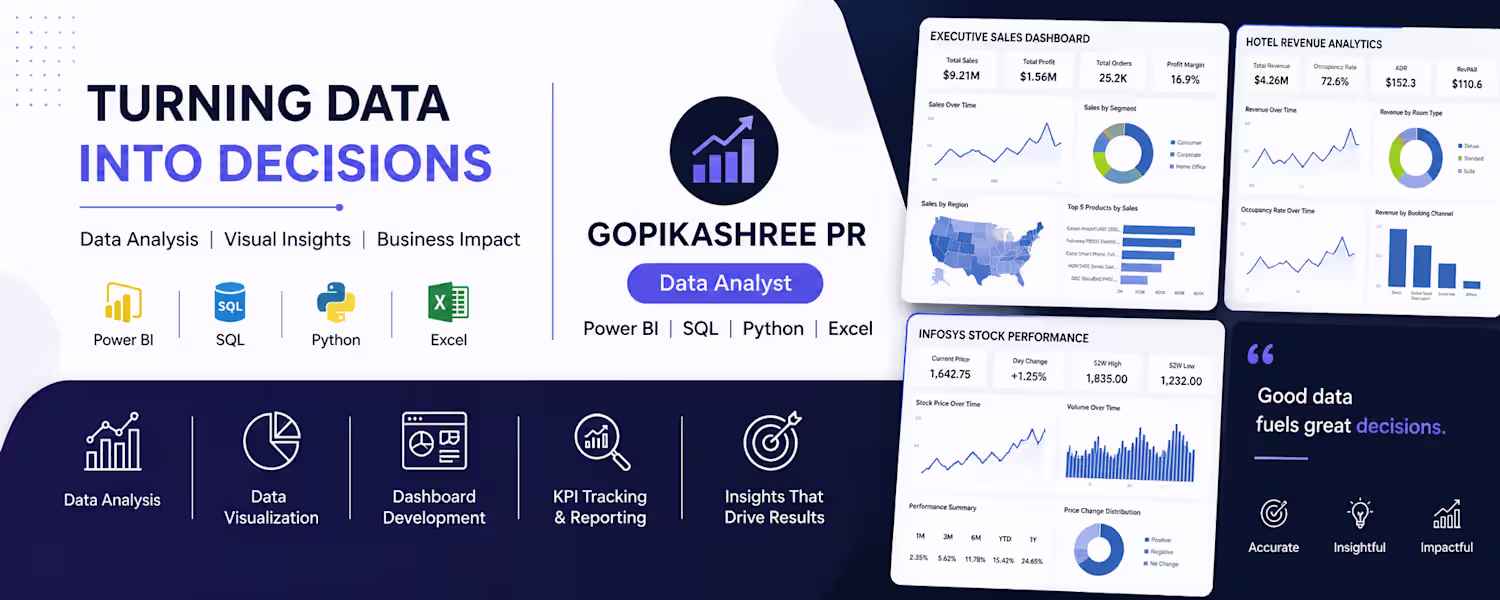
Gopikashree PR
Data Analyst | Power BI, SQL, Python & Excel
New to Contra
Gopikashree is building their profile!
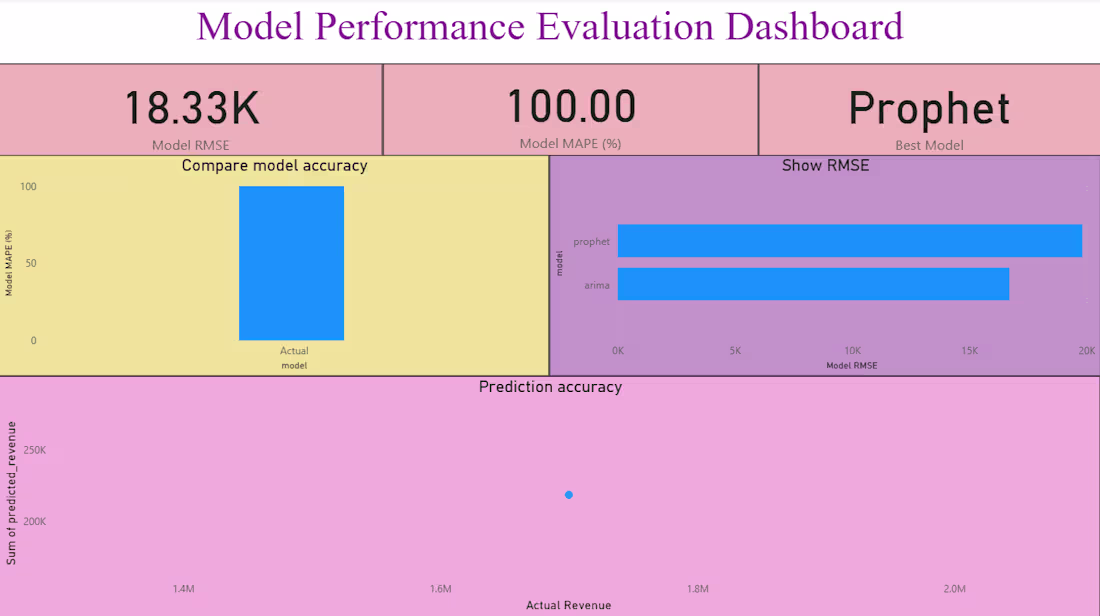
Developed an interactive Power BI dashboard to monitor financial performance, track key business KPIs, and support data-driven forecasting. The project transformed raw financial data into meaningful insights, enabling stakeholders to analyze trends, compare performance, and make informed strategic decisions.
✨ Key Highlights
📈 Financial Forecasting & Trend Analysis
🎯 KPI Tracking & Performance Monitoring
📊 Interactive Power BI Dashboard
🧹 Data Cleaning & Transformation
💰 Revenue, Profit & Expense Analysis
📅 Time-Series & Variance Analysis
💡 Executive Insights for Better Decision-Making
0
13
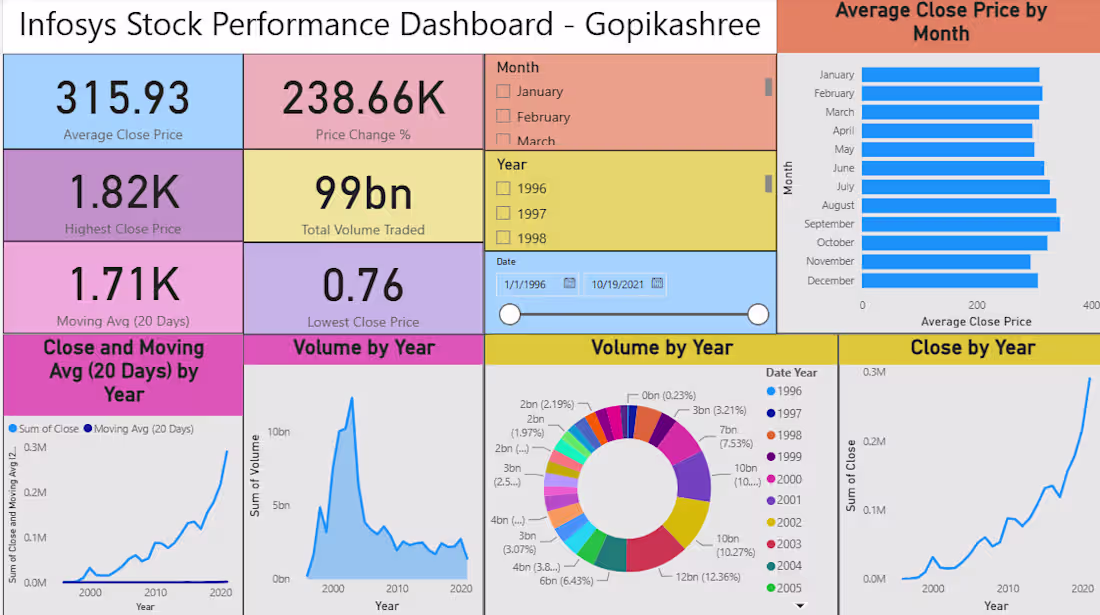
Developed an interactive Power BI dashboard to analyze Infosys stock performance and uncover meaningful financial insights from historical market data. The project focused on transforming raw stock data into clear visualizations, enabling users to track price movements, trends, and key performance indicators for informed decision-making.
✨ Key Highlights
📊 Interactive Power BI Dashboard
📈 Stock Price Trend Analysis
🧹 Data Cleaning & Transformation
💹 Performance & Market Insights
📅 Time Series Visualization
🎯 KPI & Financial Reporting
💡 Data-Driven Investment Insights
0
15
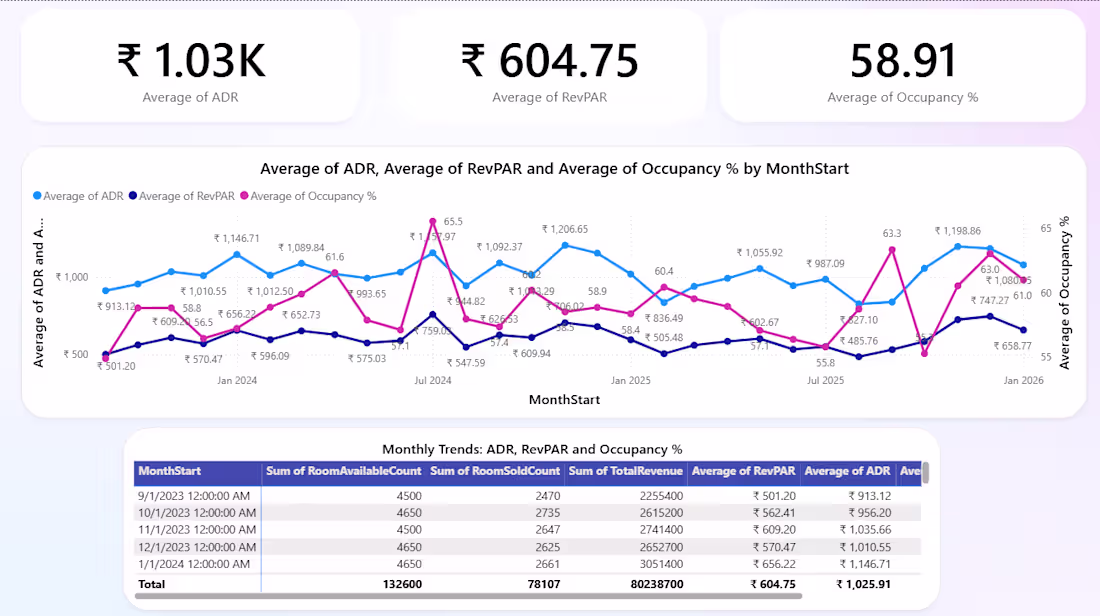
Transformed raw hotel data into an interactive Power BI dashboard that provides clear insights into revenue, occupancy, bookings, and overall business performance. The project focused on helping hotel management track key metrics, identify trends, and make data-driven decisions through intuitive visualizations and KPI reporting.
✨ Key Highlights
📊 Interactive Power BI Dashboard
🧹 Data Cleaning & Transformation
💰 Revenue & Profit Analysis
🏨 Occupancy & Booking Performance
📈 KPI & Trend Analysis
🌍 Business Insights for Better Decision-Making
0
19
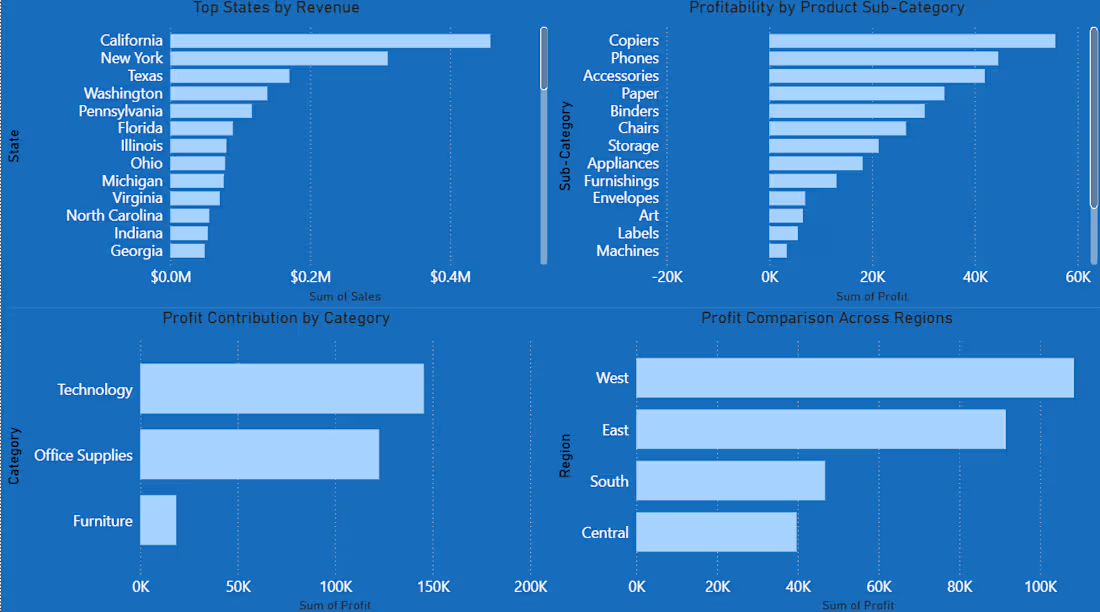
Turned raw sales data into a powerful, interactive Power BI dashboard that helps businesses make smarter, data-driven decisions. From data cleaning and SQL analysis to KPI development and dynamic visualizations, this project delivers a complete view of sales performance.
✨ Key Highlights
📊 Interactive Power BI Dashboard
🧹 Data Cleaning & Transformation
🗄️ SQL-Based Data Analysis
📈 KPI & Business Performance Tracking
🌍 Regional & Category-Wise Insights
💡 Actionable Insights for Better Decision-Making
Tools Used: Power BI • SQL • Python • Excel • Data Analysis • Data Visualization
1
62