The network for creativity
Join 1.25M professional creatives like you
Connect with clients, get discovered, and run your business 100% commission-free
Creatives on Contra have earned over $150M and we are just getting started
Back to feedPost

📊 Sales & Profit Dashboard | Business Intelligence & Data Visualization
Turning raw sales data into meaningful business insights.
I developed a Sales & Profit Dashboard to help businesses monitor performance, analyze sales trends, and understand profitability through interactive data visualization.
Key Dashboard Features:
Total Sales & Total Profit KPIs
Sales Analysis by Category
State-wise Sales Performance
Monthly Sales Trends
Profit Analysis by Year
Top 5 Customers by Profit
Customer Count Analysis
Interactive Filters for Year and Month
Business Value:
This dashboard helps business owners and management:
Monitor overall business performance.
Identify profitable product categories.
Track sales trends over time.
Understand customer contribution.
Make data-driven business decisions.
My Services:
I help businesses build customized:
Power BI Dashboards
Excel Dashboards & Automation
Sales & Financial Reports
Business Performance Reports
MIS Reporting Solutions
Data Analysis & Visualization
Looking for better visibility into your business data?
Let's discuss your reporting and analytics requirements.
#PowerBI #DataAnalytics #BusinessIntelligence #ExcelDashboard #DataVisualization #SalesAnalytics #DashboardDevelopment #FreelanceDataAnalyst


The network for creativity
Join 1.25M professional creatives like you
Connect with clients, get discovered, and run your business 100% commission-free
Creatives on Contra have earned over $150M and we are just getting started
Related posts

Real estate client for Mumbai - Ran Facebook Ads for luxury flats. Generated 89 qualified leads in 28 days, closed 3 deals worth 1.2Cr revenue at $3.45 CPL.


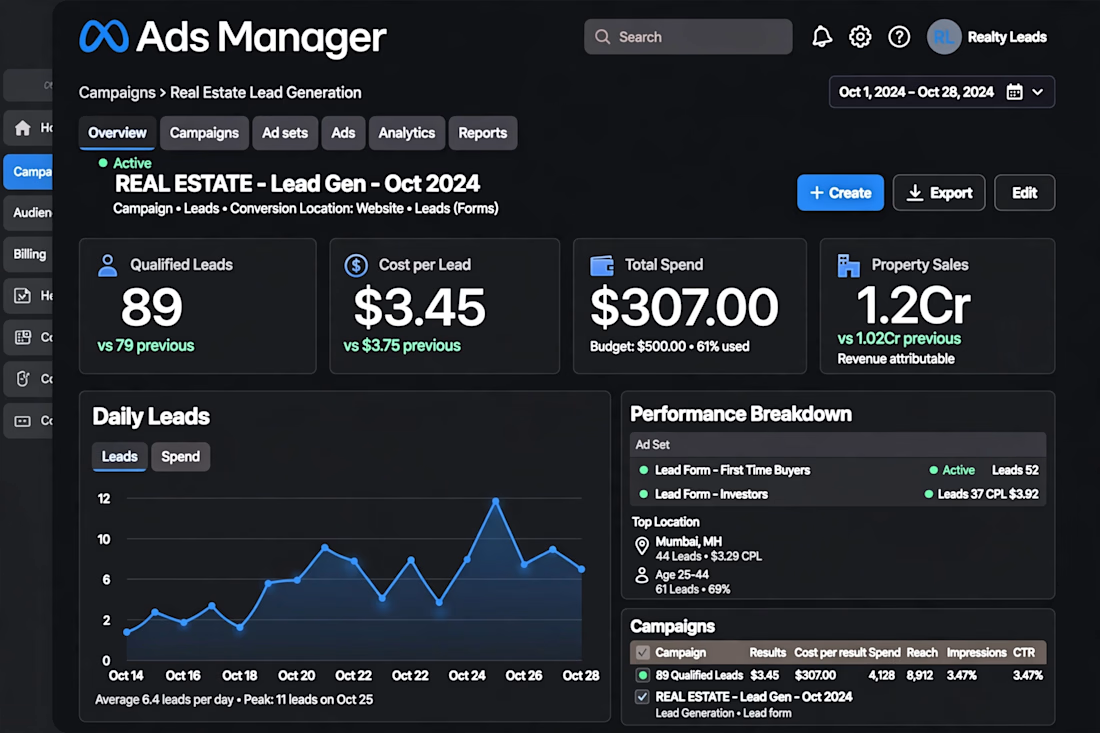

The dashboard view makes the funnel easy to follow. For luxury flats, which creative angle pulled the cheapest leads: lifestyle shots or the location and price hook?


Mobile dashboard sheet interaction for sales automation platform

🔥 Designed and developed a comprehensive, interactive multi-page Power BI dashboard focused on sales performance and product profitability analysis. This project enables businesses to track core metrics dynamically across different regions, payment methods, and product categories with advanced slicers and visual breakdowns.
🌟 Key Highlights of the Project:
Page 1 (Sales Overview): Features high-level KPI cards (2,918 Total Orders, 372K Total Sales, 5,890 Total Quantity, and 6.74% Discount), along with interactive slicers for Country, Payment Method, and Product Category. It also includes visual breakdowns like Order Status and Payment Analysis.
Page 2 (Profit & Product Analysis): Deep dives into product-level performance, featuring a detailed sales table, pricing filters, and category-wise distributions to evaluate profitability effectivel.🔥