
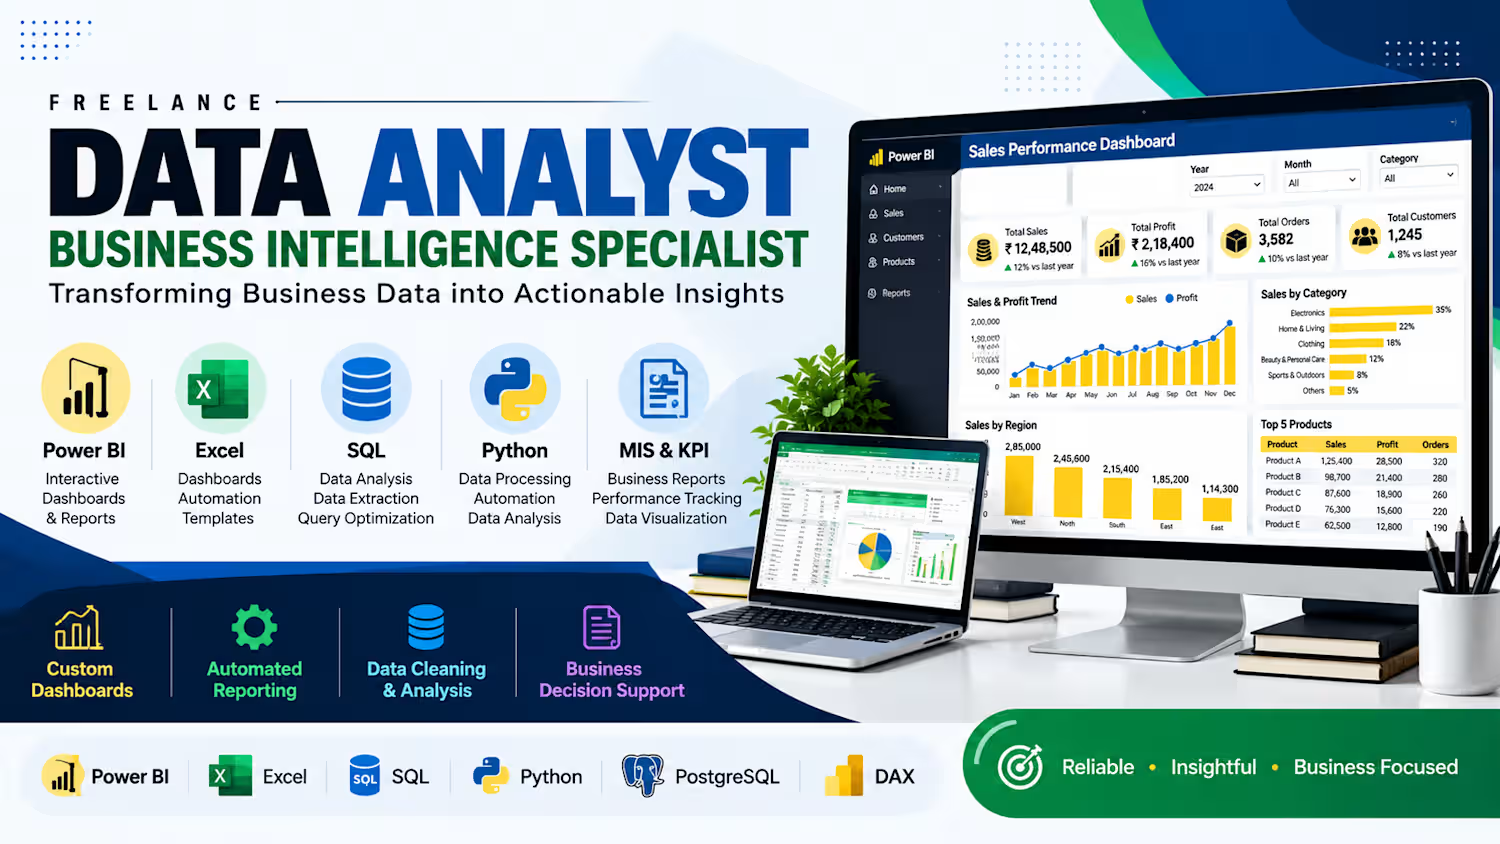
Folder-Based Power BI Reporting Automation
This project demonstrates an automated reporting workflow using Power BI and Power Query.
The workflow uses a folder-based data source to combine and transform data from multiple files into a consolidated dataset. This data is then used to build an interactive Power BI Sales Performance Dashboard.
Key Components:
Folder-based data connection
Combining data from multiple files
Data cleaning and transformation using Power Query
Automated data refresh workflow
Sales performance KPI tracking
Monthly sales trend analysis
Product and category-wise performance
Interactive dashboard with filters
Tools Used: Microsoft Power BI, Power Query, Excel.
0
16
📊 Excel Project Management Tracker | Task Management, Progress Monitoring & Automated Timeline
Managing projects involves more than assigning tasks. Businesses also need to monitor deadlines, task completion, responsibilities, delays and overall project progress.
I developed and sold this Excel-based Project Management Tracker to organise project activities and monitor progress through a structured reporting system.
Key Features:
✅ Project Management Start Date & Current Date
✅ Activity and Task Tracking
✅ Project Manager Assignment
✅ Planned Start Date & End Date
✅ Task Duration Calculation
✅ Actual Start Date Tracking
✅ Completion Percentage with Data Bars
✅ Dropdown-Based Project Status
✅ Conditional Formatting with Automatic Status Colours
✅ Gantt-Style Project Timeline
✅ Remarks & Support Required Tracking
This type of Excel solution can help businesses organise project information, monitor task progress, identify delays and maintain better visibility over ongoing activities.
Business Reporting & Analytics Services
I work on customized reporting and data solutions based on business requirements, available data and operational challenges.
My services include:
📁 Data Management: Data Entry, Data Collection, Data Cleaning, Data Validation, Data Consolidation and Data Preparation.
📊 Excel Solutions: Excel Dashboards, Advanced Excel Reports, MIS Reporting, Automated Trackers, Management Reports and Custom Excel Solutions.
📈 Power BI Solutions: Interactive Dashboards, KPI Reporting, Sales & Profitability Dashboards, Inventory Dashboards and Business Performance Reporting.
🗄️ Data Analysis: SQL Data Analysis, Business Analysis, Performance Analysis and Reporting from Multiple Data Sources.
🏢 Business & Industry Reporting:
Sales, Revenue & Profitability
Finance, Accounts Receivable & Payable
Inventory & Stock Management
Purchase & Procurement
Production & Manufacturing
E-commerce & Marketplace Orders
Customer & Product Analysis
Marketing & Logistics
Project & Operations Management
Other customized business reports
⚙️ Reporting Automation: Data Consolidation, Automated Report Preparation, Recurring MIS Reports and Reporting Workflows.
Have a reporting requirement, data management challenge, manual reporting process or a specific business data need?
Let's discuss your requirements and identify a suitable reporting solution based on your business data and objectives.
#Excel #ExcelDashboard #ProjectManagement #MISReporting #DataAnalytics #PowerBI #ExcelAutomation #BusinessIntelligence #DataCleaning #ReportingAutomation
0
24
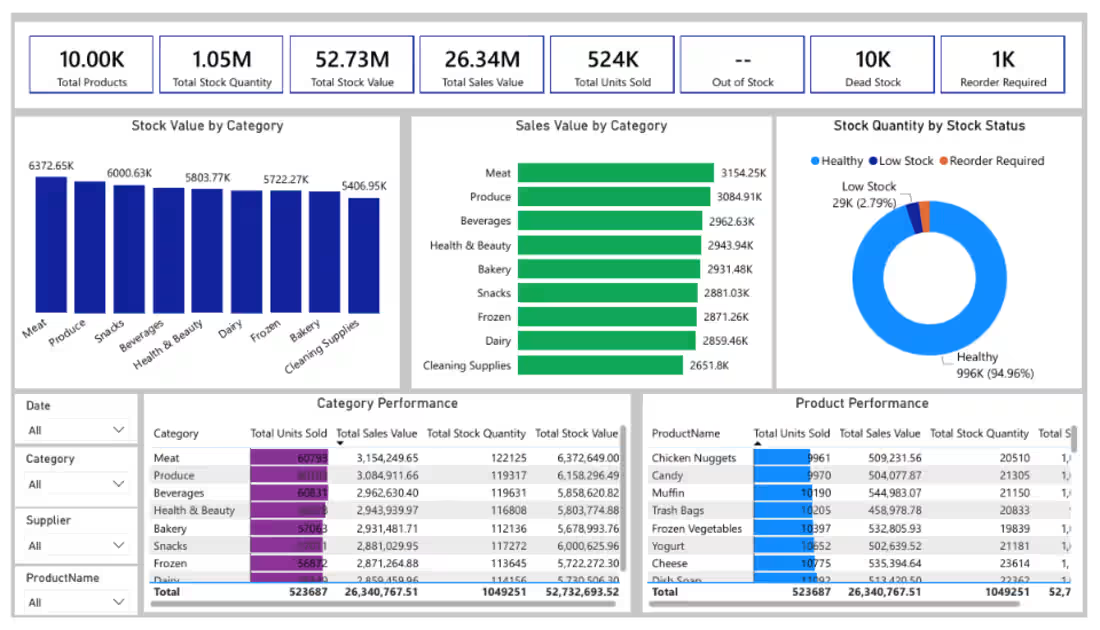
Inventory & Stock Management Dashboard
An interactive dashboard designed to monitor inventory levels, stock value, product performance, and stock availability across multiple product categories.
Key Components:
Total Products & Stock Quantity
Total Stock Value
Total Sales Value
Total Units Sold
Out of Stock & Dead Stock
Reorder Required Products
Stock Value by Category
Sales Value by Category
Stock Status Analysis
Category-wise Product Performance
Supplier and Product Filters
Inventory Performance Summary
Purpose:
To monitor inventory performance, analyze stock distribution, identify low-stock and out-of-stock products, and track inventory value and sales performance.
0
22
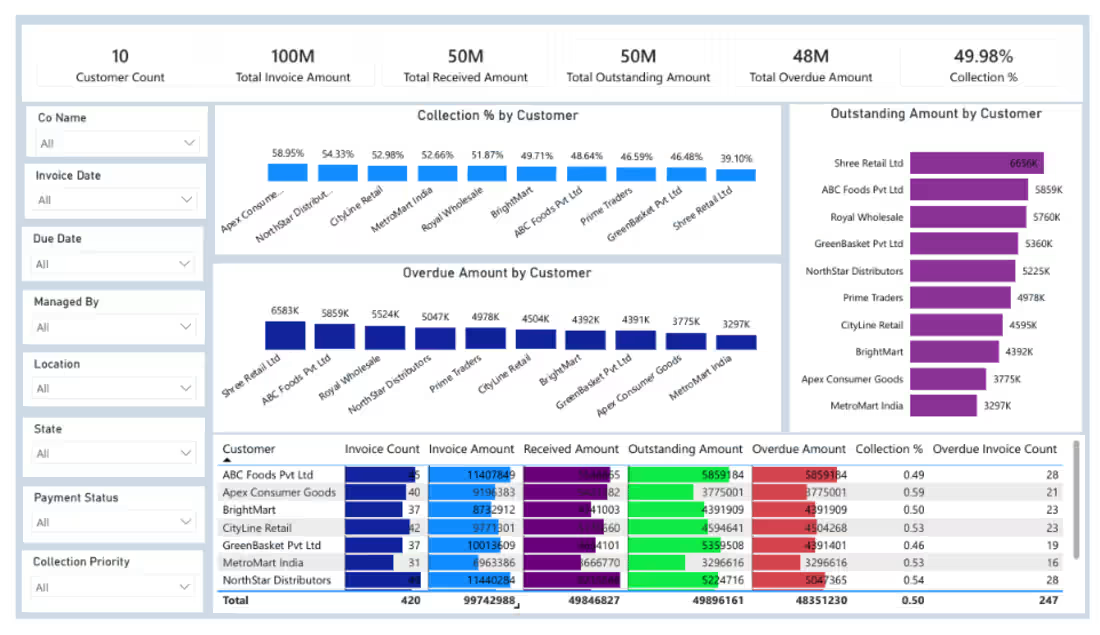
Accounts Receivable Dashboard
An interactive Accounts Receivable dashboard developed to monitor customer invoices, outstanding balances, overdue amounts, and payment collection performance.
Key Components:
Total Invoice Amount
Total Received Amount
Total Outstanding Amount
Total Overdue Amount
Collection Percentage
Customer-wise Outstanding Analysis
Overdue Amount by Customer
Invoice and Payment Status
Customer Collection Performance
Interactive Filters
Tools: Microsoft Excel / Power BI (select the actual tools used).
0
29