The network for creativity
Join 1.25M professional creatives like you
Connect with clients, get discovered, and run your business 100% commission-free
Creatives on Contra have earned over $150M and we are just getting started
Back to feedPost

🔥 Designed and developed a comprehensive, interactive multi-page Power BI dashboard focused on sales performance and product profitability analysis. This project enables businesses to track core metrics dynamically across different regions, payment methods, and product categories with advanced slicers and visual breakdowns.
🌟 Key Highlights of the Project:
Page 1 (Sales Overview): Features high-level KPI cards (2,918 Total Orders, 372K Total Sales, 5,890 Total Quantity, and 6.74% Discount), along with interactive slicers for Country, Payment Method, and Product Category. It also includes visual breakdowns like Order Status and Payment Analysis.
Page 2 (Profit & Product Analysis): Deep dives into product-level performance, featuring a detailed sales table, pricing filters, and category-wise distributions to evaluate profitability effectivel.🔥


The network for creativity
Join 1.25M professional creatives like you
Connect with clients, get discovered, and run your business 100% commission-free
Creatives on Contra have earned over $150M and we are just getting started
Related posts


Great stuff! Would love to know what the brief looked like. You clearly took it somewhere special.

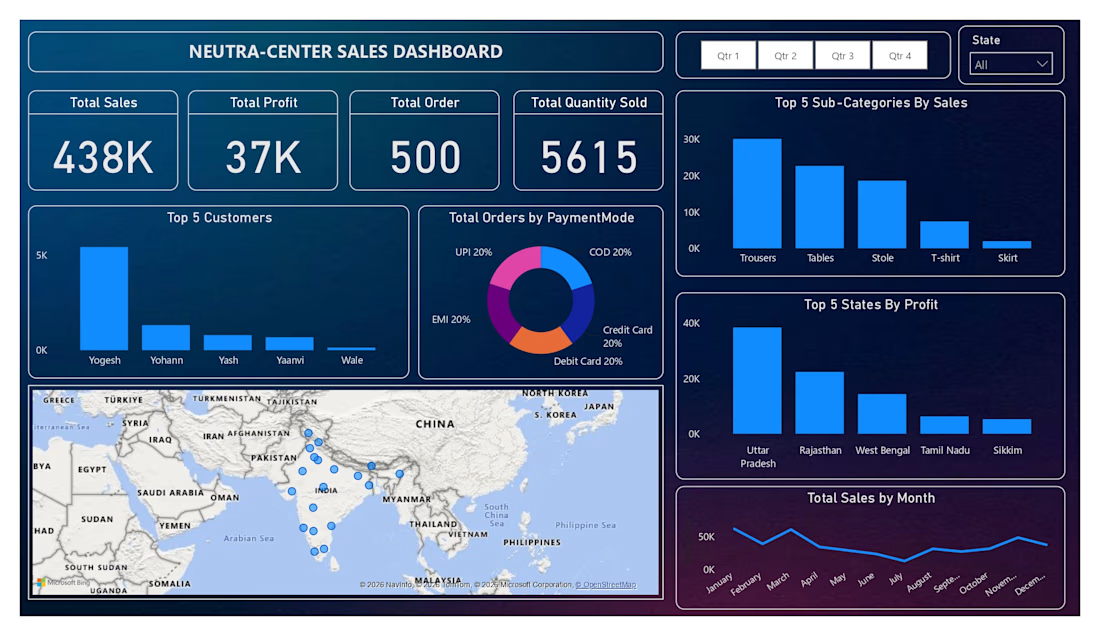
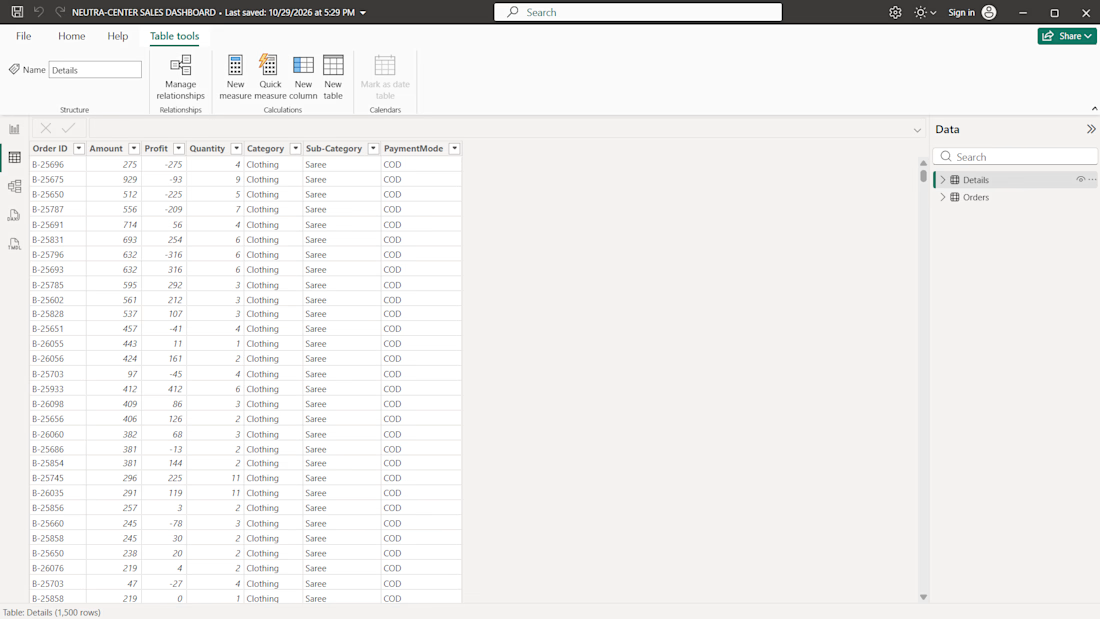
I created an interactive "Neutra-Center Sales Dashboard using Microsoft Power BI" to transform sales excel data into clear, meaningful business insights.
Key Features:
- Interactive quarterly and state filters
- Sales and profit KPI cards
- Customer and product performance analysis
- Payments method distribution
- State-wise profit coparison
- Monthly sales trend visualization
- Geographic sales distribution map
- Clean, modern dashboard design
This project demonstrates my ability to present sales data in an organized, interactive, and visually appealing format to help user understand business performance and identify important trends.

Accounts Receivable Dashboard
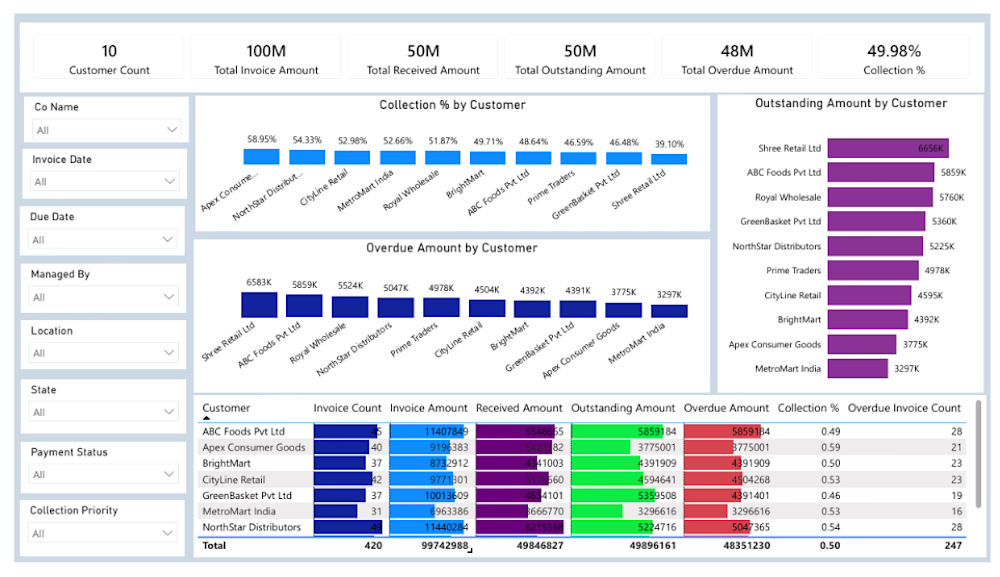
An interactive Accounts Receivable dashboard developed to monitor customer invoices, outstanding balances, overdue amounts, and payment collection performance.
Key Components:
Total Invoice Amount
Total Received Amount
Total Outstanding Amount
Total Overdue Amount
Collection Percentage
Customer-wise Outstanding Analysis
Overdue Amount by Customer
Invoice and Payment Status
Customer Collection Performance
Interactive Filters
Tools: Microsoft Excel / Power BI (select the actual tools used).