The network for creativity
Join 1.25M professional creatives like you
Connect with clients, get discovered, and run your business 100% commission-free
Creatives on Contra have earned over $150M and we are just getting started
Back to feedPost

Project Title
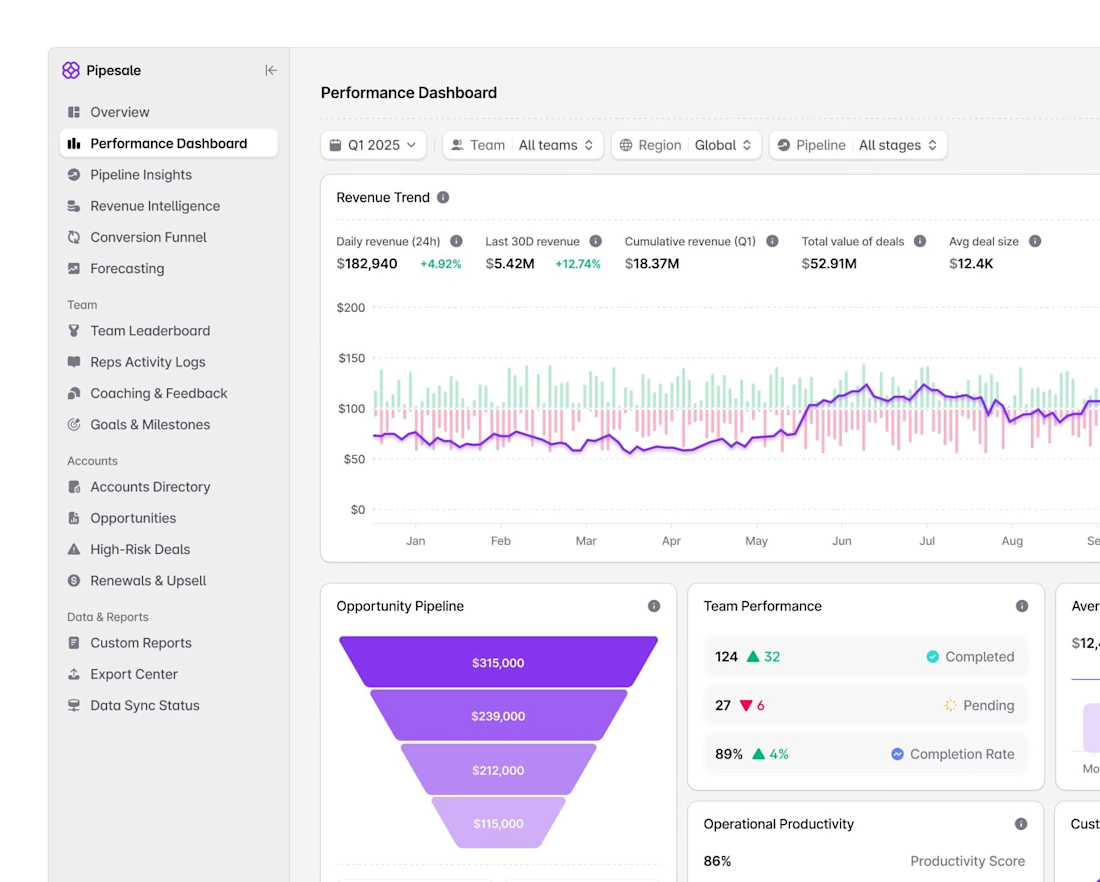
Sales Performance & Revenue Intelligence Dashboard
Project Description
Designed and developed a modern sales analytics dashboard that provides businesses with a centralized view of revenue, sales performance, pipeline activity, team productivity, and business growth metrics.
The dashboard features an intuitive navigation system and interactive data visualization, allowing sales teams and managers to quickly analyze performance trends, monitor opportunities, track conversion activity, and make data-driven decisions.
Key Features
Real-time revenue and sales performance overview
Revenue trend visualization and analytics
Opportunity pipeline tracking
Team performance monitoring
Sales forecasting and revenue intelligence
Conversion funnel analysis
Team leaderboard and activity tracking
Goals and milestone management
Account and opportunity management
High-risk deal monitoring
Renewals and upsell tracking
Custom reports and data export
Regional, team, date, and pipeline filters
Clean and responsive SaaS dashboard interface
Project Focus
The goal was to create a powerful sales intelligence platform that transforms complex business data into clear, actionable insights. The interface was designed for sales managers, business leaders, and teams that need to monitor revenue and performance efficiently.
Tools & Technologies: UI/UX Design, SaaS Dashboard Development, Data Visualization, Analytics, Responsive Web Design, Sales Management Systems.


The network for creativity
Join 1.25M professional creatives like you
Connect with clients, get discovered, and run your business 100% commission-free
Creatives on Contra have earned over $150M and we are just getting started
Related posts




Awesome dude

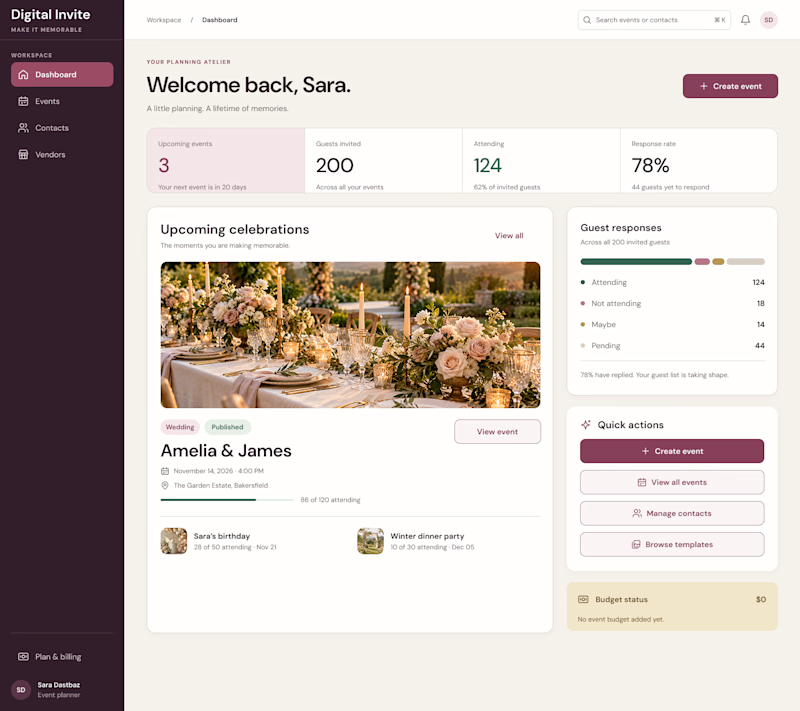
AI can generate a dashboard. But can it give a product its own identity?
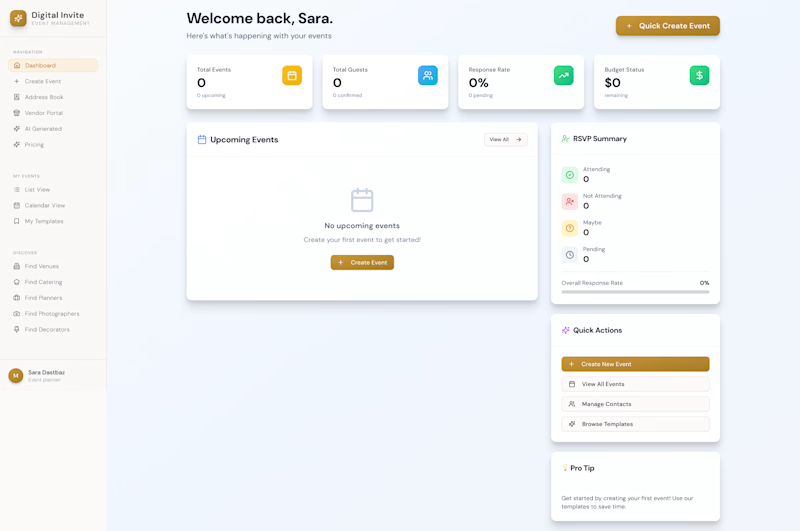
The first design was created by my client using AI a familiar dashboard style you've probably seen across countless AI-generated products.
I redesigned it to feel less generic and more intentional, with a distinctive visual identity, clearer hierarchy, and an experience built around meaningful celebrations.
The goal wasn't just to make it look better. It was to make it feel like its own product.
What do you think is missing from most AI-generated interfaces?
#ProductDesign #UIDesign #AI

5 voted
23%
17 voted
77%
22 votes
Closed

I think personality is what makes a product stand out. A clean design is good, but it should also feel unique and memorable. 👏


Amazing execution and perfect presentation


