The network for creativity
Join 1.25M professional creatives like you
Connect with clients, get discovered, and run your business 100% commission-free
Creatives on Contra have earned over $150M and we are just getting started
Back to feedPost

Cleaned multiple messy datasets to help build an interactive dashboard giving educational decision-makers the opportunity to see how their budget (between £500k - £50M) could be spent with the highest impact for good. This takes into account deprivation, pollution levels, and density of the area.


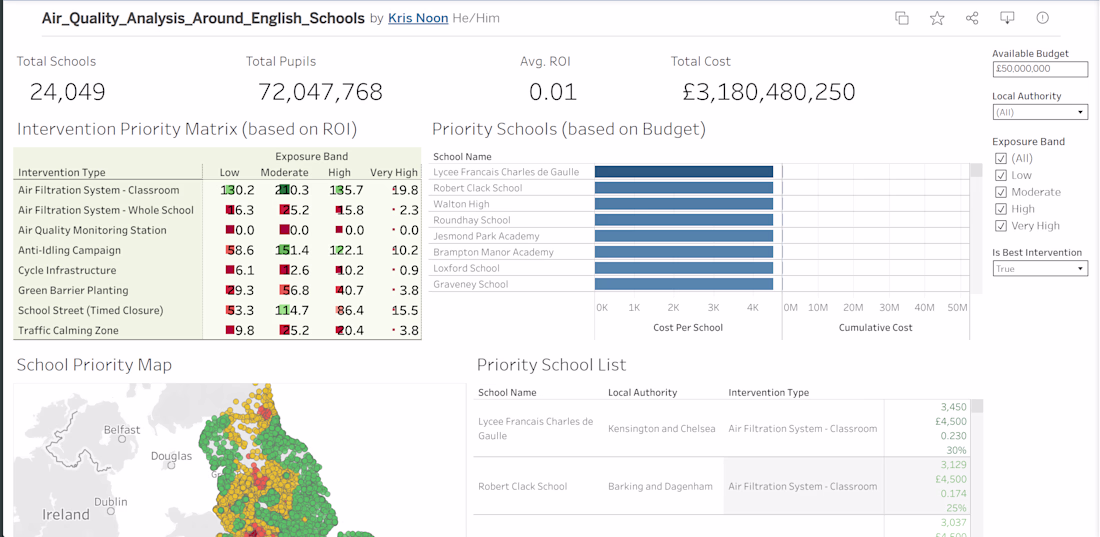

Cleaning multiple messy datasets before building the dashboard is the right approach — the priority matrix with ROI across exposure bands gives decision-makers a clear framework for allocating budget where it has the highest impact. Really thoughtful work!
The network for creativity
Join 1.25M professional creatives like you
Connect with clients, get discovered, and run your business 100% commission-free
Creatives on Contra have earned over $150M and we are just getting started
Related posts


i prefer light... Prem, did you designed it from the scratch?

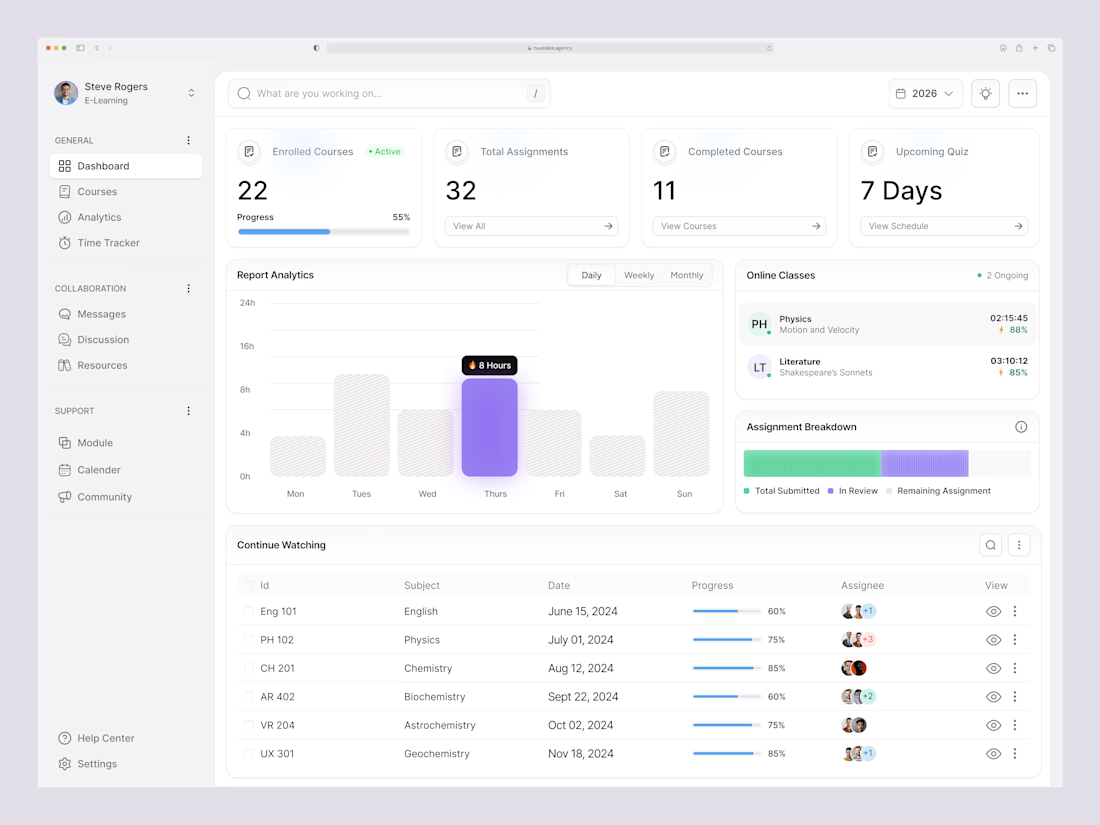
E-Learning Student Dashboard — Course Tracking & Study Analytics

great
This Project Overview Dashboard provides a comprehensive view of project performance, financial outcomes, and operational progress across the organization. Built using Power BI, this dashboard enables project managers and executives to monitor key project metrics, evaluate cost efficiency, and track overall project status in real time.
Key KPIs Tracked:
✔ Total Projects – Number of active and completed projects
✔ Project Cost – Total investment allocated across projects
✔ Project Benefit – Estimated value or return generated from projects
✔ Net Benefit – Difference between project benefit and cost
✔ Average Completion Rate – Overall project progress percentage


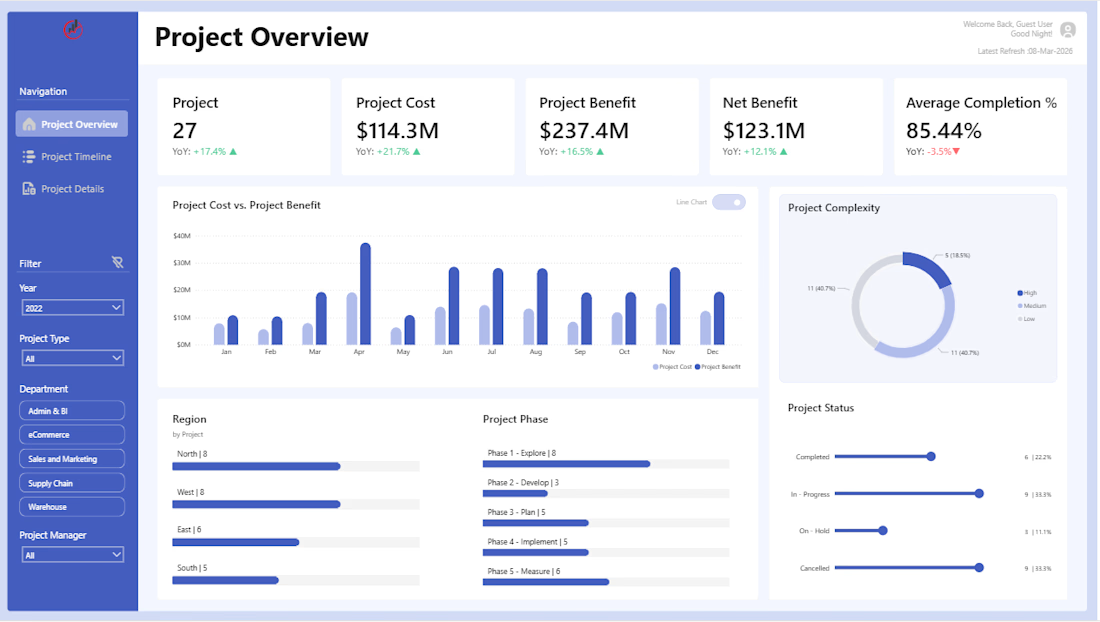
Tracking Net Benefit alongside Project Cost in real time is really powerful for executive decision making — gives leadership the full financial picture without digging into raw data. Well structured dashboard!


Trending
aivideo
AI video tools are moving at warp speed. Which ones are you experimenting with?
returntonature
Spring is a reset for creativity. What’s inspiring you outside the screen right now?
aidesignflow
AI tools are redefining design work. What's your current workflow?
freelancerlife
Freelancer life is wins, pivots, and everything in between. What’s yours right now?
allthingsmetal
Metal is having a design moment – from chrome to gates and grates. What designs are you forging?