The network for creativity
Join 1.25M professional creatives like you
Connect with clients, get discovered, and run your business 100% commission-free
Creatives on Contra have earned over $150M and we are just getting started
Back to feedPost

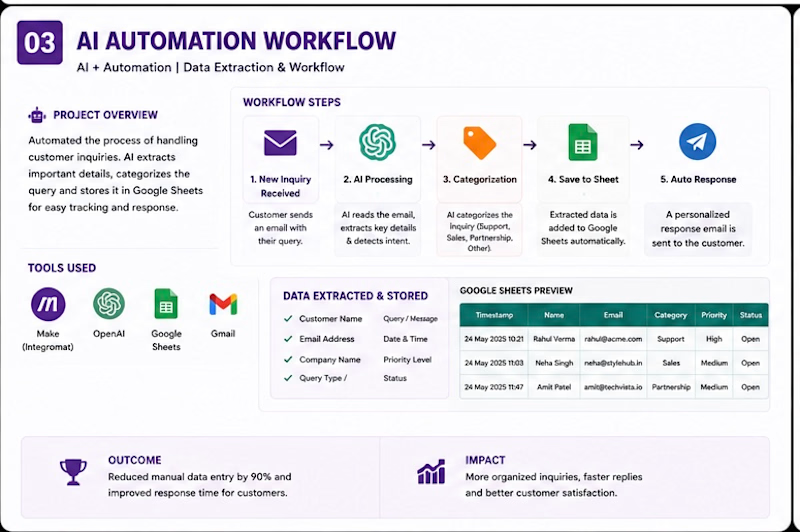
Built a sales analytics dashboard to organize data, track key performance indicators, analyze revenue trends, compare product and regional performance, and present business insights through clear, interactive visualizations.


The network for creativity
Join 1.25M professional creatives like you
Connect with clients, get discovered, and run your business 100% commission-free
Creatives on Contra have earned over $150M and we are just getting started


Related posts

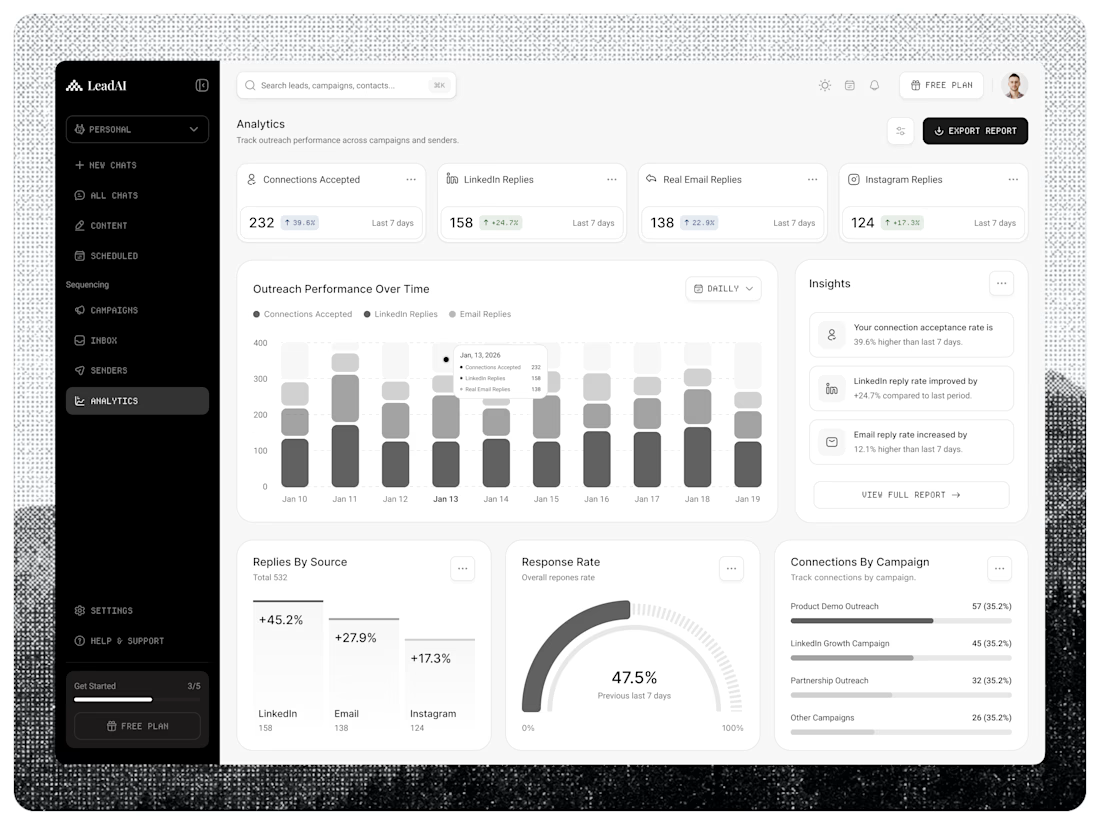
AI-Powered Prospecting SaaS Platform | Analytics Dashboard
LeadAI — AI-Powered Prospecting SaaS Platform A modern AI-powered prospecting platform designed to help sales teams discover high-quality leads, automate outreach, manage campaigns, and turn prospects into opportunities.
The experience combines AI assistance, lead generation, email & LinkedIn outreach, campaign management, analytics, and smart sales workflows into one clean, intuitive SaaS platform.
Designed for: SaaS Founders, Sales Teams, Growth Teams & B2B Businesses.
Focus: AI • Lead Generation • Sales Automation • CRM • SaaS • Dashboard • UI/UX • Product Design Designed with Figma. Interested in building a modern SaaS, AI product, CRM, dashboard, or B2B web application?
Available for UI/UX & AI Product Design projects. 🎯
✅ Full-Time | Contract | Remote



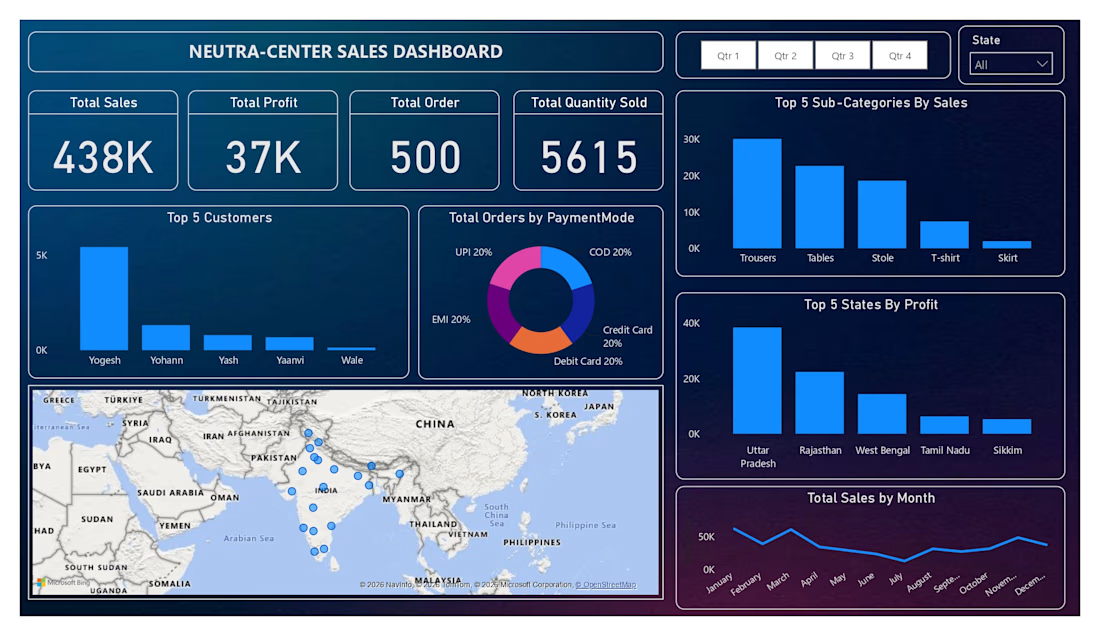
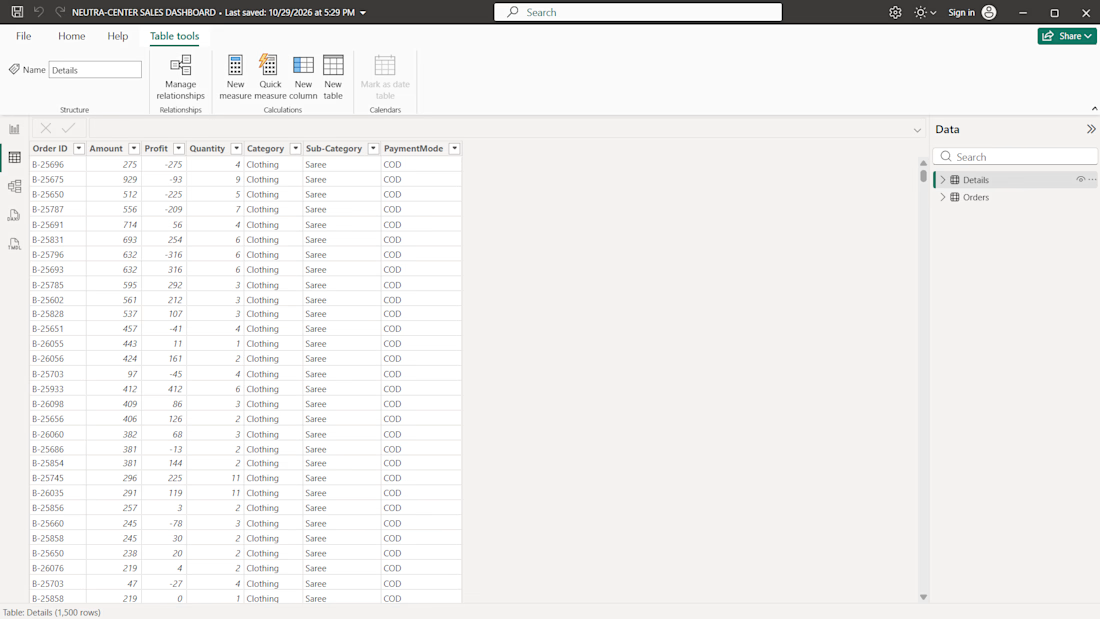
I created an interactive "Neutra-Center Sales Dashboard using Microsoft Power BI" to transform sales excel data into clear, meaningful business insights.
Key Features:
- Interactive quarterly and state filters
- Sales and profit KPI cards
- Customer and product performance analysis
- Payments method distribution
- State-wise profit coparison
- Monthly sales trend visualization
- Geographic sales distribution map
- Clean, modern dashboard design
This project demonstrates my ability to present sales data in an organized, interactive, and visually appealing format to help user understand business performance and identify important trends.


📊 Sales & Profit Dashboard | Business Intelligence & Data Visualization
Turning raw sales data into meaningful business insights.
I developed a Sales & Profit Dashboard to help businesses monitor performance, analyze sales trends, and understand profitability through interactive data visualization.
Key Dashboard Features:
Total Sales & Total Profit KPIs
Sales Analysis by Category
State-wise Sales Performance
Monthly Sales Trends
Profit Analysis by Year
Top 5 Customers by Profit
Customer Count Analysis
Interactive Filters for Year and Month
Business Value:
This dashboard helps business owners and management:
Monitor overall business performance.
Identify profitable product categories.
Track sales trends over time.
Understand customer contribution.
Make data-driven business decisions.
My Services:
I help businesses build customized:
Power BI Dashboards
Excel Dashboards & Automation
Sales & Financial Reports
Business Performance Reports
MIS Reporting Solutions
Data Analysis & Visualization
Looking for better visibility into your business data?
Let's discuss your reporting and analytics requirements.
#PowerBI #DataAnalytics #BusinessIntelligence #ExcelDashboard #DataVisualization #SalesAnalytics #DashboardDevelopment #FreelanceDataAnalyst