The network for creativity
Join 1.25M professional creatives like you
Connect with clients, get discovered, and run your business 100% commission-free
Creatives on Contra have earned over $150M and we are just getting started
Back to feedPost

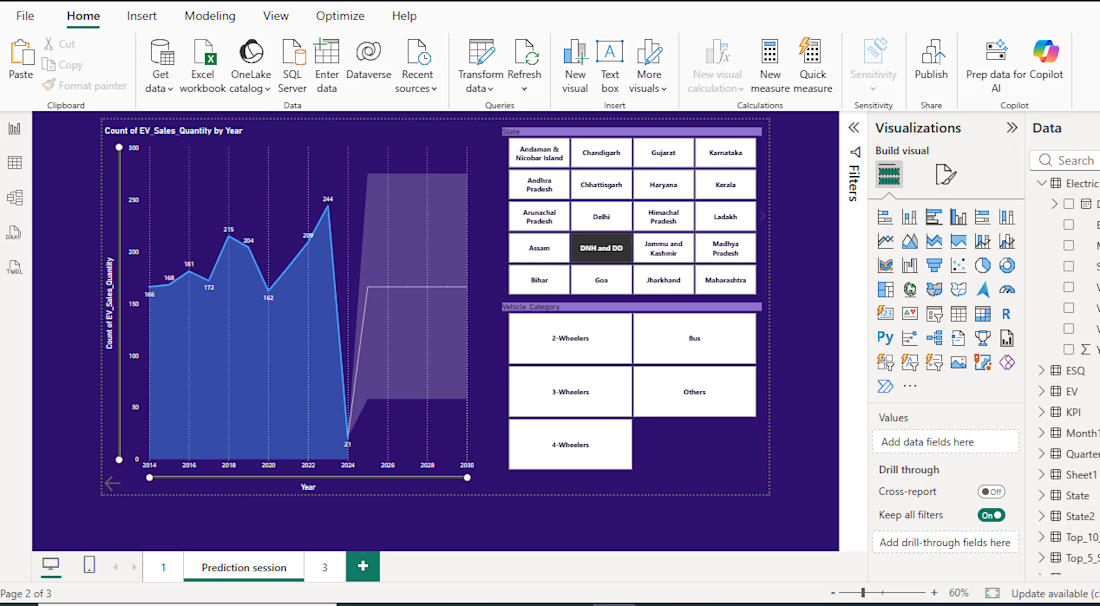
Sales Quantity Forecasting & Visual Analytics (Power BI)
Overview:
A predictive data analysis project focused on modeling and forecasting sales quantities using Power BI. Designed to help businesses anticipate demand, monitor key trends, and make data-backed inventory decisions.
Key Analysis & Process:
Data Preparation & Modeling: Cleaned historical sales data and established data relationships within Power BI.
Predictive Visualization: Applied Power BI’s built-in forecasting features and time-series visual trends to project future sales quantities.
Interactive Dashboard Design: Built dynamic charts, filters, and KPIs (e.g., total sales, forecasted growth, volume changes) for seamless data exploration.
Outcome:
Delivered an interactive dashboard that translates raw historical and projected sales metrics into clear visual insights, helping stakeholders identify future demand trends at a glance.

The network for creativity
Join 1.25M professional creatives like you
Connect with clients, get discovered, and run your business 100% commission-free
Creatives on Contra have earned over $150M and we are just getting started





Trending
retrofuturism
Share your favorite designs from the past exploring the distant future. Or your own take on the aesthetic 🚀
halftone
Dots. Texture. Grain. Let's see your designs using the halftone technique.

Midjourney
Creatives are showing off what they're making with Midjourney.
colorgrade
Video editors sound off: How do you enhance the mood of your video in color grading?
Related posts

🚀 My First AI Automation Project with n8n
I recently built my first automation project — an AI-Powered Invoice Extraction & Tracking System.
The problem I wanted to solve was simple:
Imagine a business receiving dozens of invoices or cash memos every week. Someone has to open each file, read the information, and manually enter the vendor name, date, items, total amount, and category into a spreadsheet.
That’s repetitive, time-consuming, and easy to get wrong.
So I built a workflow where:
📂 An invoice is uploaded to Google Drive
→ 🤖 Gemini AI reads and extracts the invoice data
→ ⚙️ n8n processes and validates the information
→ 📊 The data is automatically added to Google Sheets
The best part?
No manual data entry. Just upload the invoice and the rest happens automatically.
While building it, I also worked with things like workflow triggers, loop control, API errors/retries, and handling multiple files.
For me, this project was less about simply “building an n8n workflow” and more about learning how AI + automation + data workflows can solve real business problems.
This is just my first step into AI automation, and I’m excited to build more practical systems like this.
If your business has a repetitive process that could be automated with AI, n8n, or data workflows, feel free to DM me. I’d be happy to discuss it.
#AIAutomation #n8n #Automation #ArtificialIntelligence #DataAnalytics #DataAnalyst #WorkflowAutomation #GenerativeAI #BusinessAutomation #AI


Smart pipeline! Have you added strict JSON schema validation after Gemini extracts the invoice fields? Found that it stops edge case hallucinations before the data ever hits Sheets.

Title:
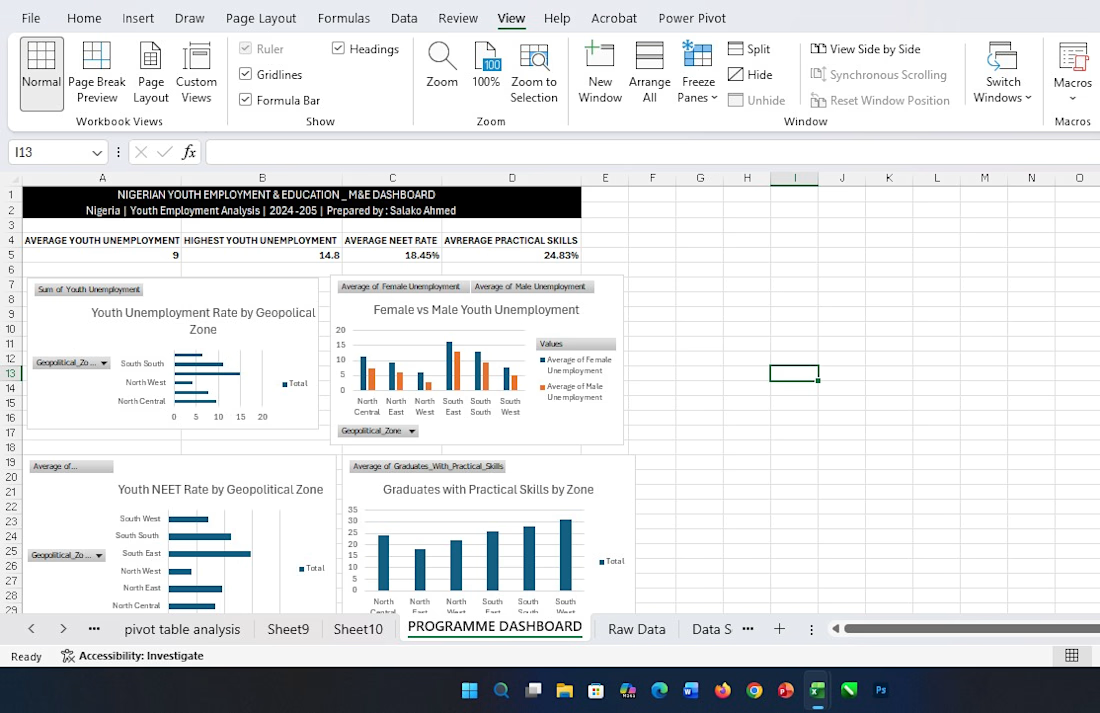
Youth Skills Training Programme — Excel M&E Dashboard
Excel-based M&E analysis project covering data cleaning, formulas, PivotTables, charts and dashboard development.
Full Description:
Analysed a simulated youth training dataset using Excel to clean, structure and interpret programme data. Built PivotTables, charts, KPI summaries and an interactive monitoring dashboard to present attendance and assessment performance.


Nigerian Youth Unemployment — Power BI Dashboard
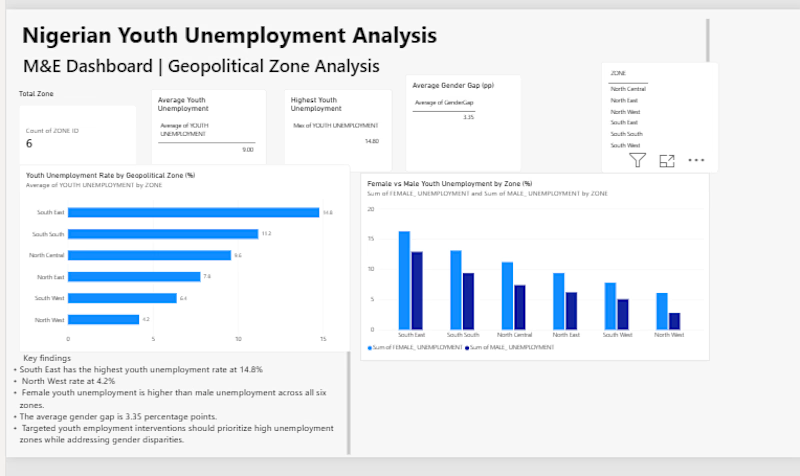
I built this Power BI dashboard to analyse youth unemployment across Nigeria’s six geopolitical zones using data from the National Bureau of Statistics (NBS).
The aim was to take the data beyond a spreadsheet and make it easier to see where unemployment and related challenges are more pronounced.
What I worked on
Created KPI cards for the main unemployment indicators
Compared unemployment rates across the six geopolitical zones
Analysed the difference between female and male unemployment
Looked at NEET rates (young people not in education, employment or training)
Added a zone slicer so users can explore the data by region
Created DAX measures for gender gap and above-average unemployment
Added key findings and programme recommendations based on the results
One of the main findings was that the South East had the highest youth unemployment rate at 14.8%, with a NEET rate of 29.6%.
Tools: Power BI, DAX, Microsoft Excel
Data: National Bureau of Statistics Nigeria — Labour Force Survey
This project helped me practise turning raw data into a dashboard that can be used to understand patterns and support programme and policy decisions.: