The network for creativity
Join 1.25M professional creatives like you
Connect with clients, get discovered, and run your business 100% commission-free
Creatives on Contra have earned over $150M and we are just getting started
Back to feedPost

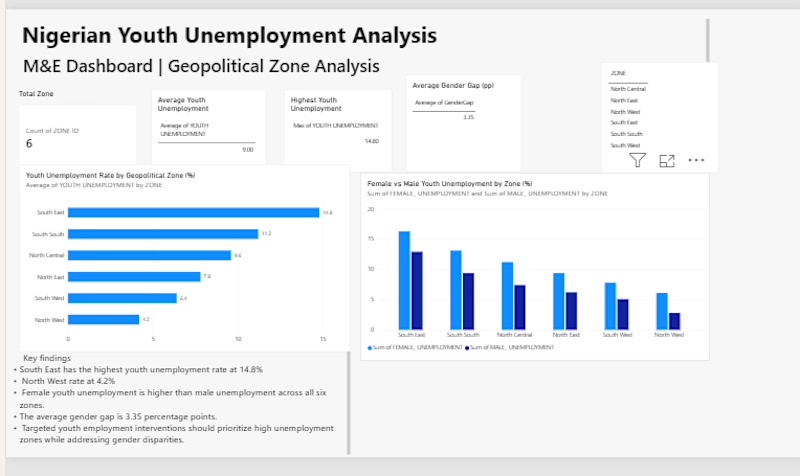
Nigerian Youth Unemployment — Power BI Dashboard
I built this Power BI dashboard to analyse youth unemployment across Nigeria’s six geopolitical zones using data from the National Bureau of Statistics (NBS).
The aim was to take the data beyond a spreadsheet and make it easier to see where unemployment and related challenges are more pronounced.
What I worked on
Created KPI cards for the main unemployment indicators
Compared unemployment rates across the six geopolitical zones
Analysed the difference between female and male unemployment
Looked at NEET rates (young people not in education, employment or training)
Added a zone slicer so users can explore the data by region
Created DAX measures for gender gap and above-average unemployment
Added key findings and programme recommendations based on the results
One of the main findings was that the South East had the highest youth unemployment rate at 14.8%, with a NEET rate of 29.6%.
Tools: Power BI, DAX, Microsoft Excel
Data: National Bureau of Statistics Nigeria — Labour Force Survey
This project helped me practise turning raw data into a dashboard that can be used to understand patterns and support programme and policy decisions.:


The network for creativity
Join 1.25M professional creatives like you
Connect with clients, get discovered, and run your business 100% commission-free
Creatives on Contra have earned over $150M and we are just getting started











Related posts

What are your thoughts on the ongoing Power BI conversation?
In the meantime, lets have a look at this Marketing Analytics Dashboard.


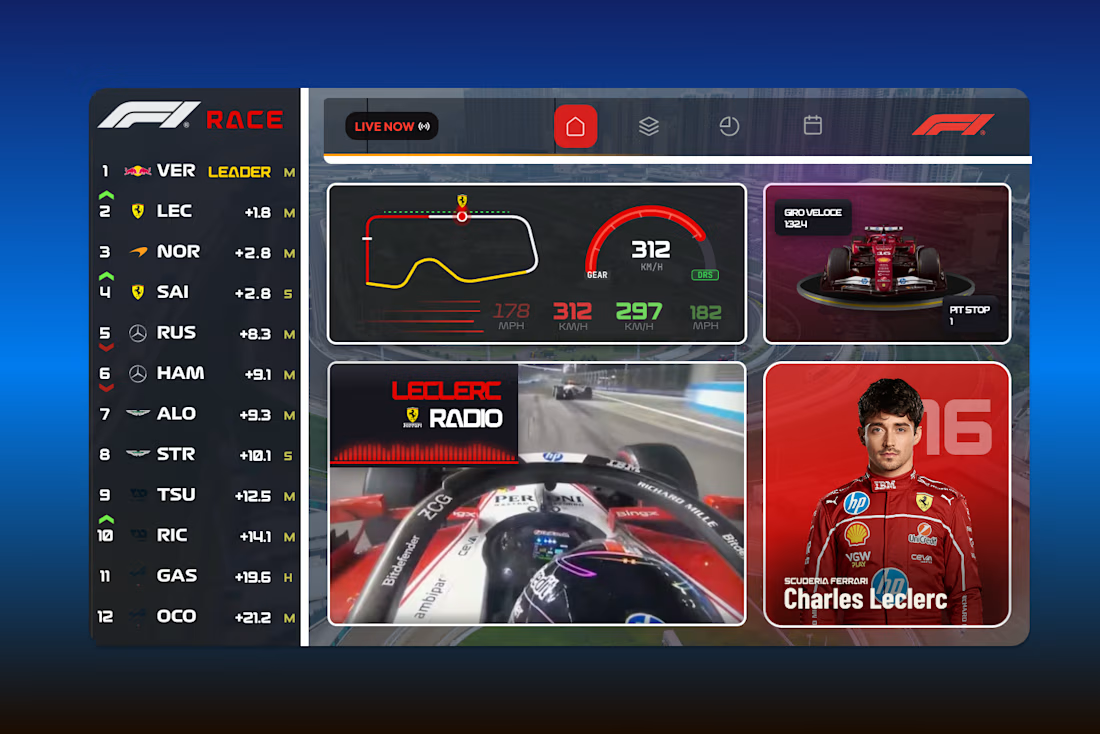
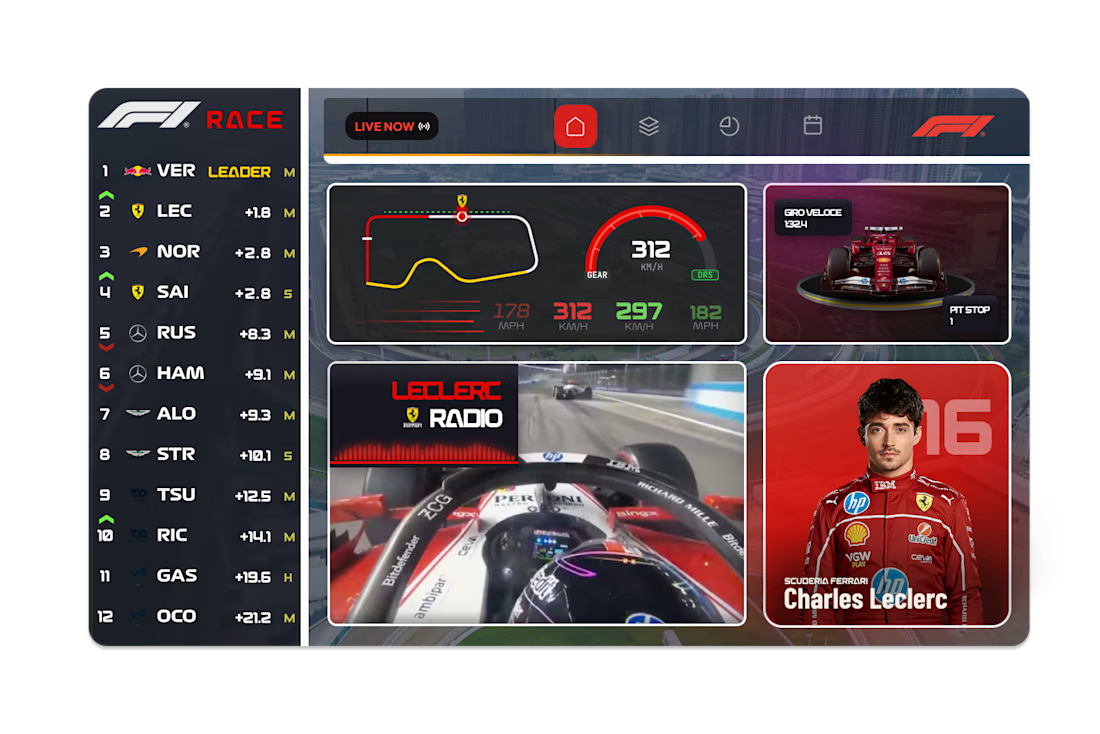
F1 Live Race Dashboard - UI Concept
A live race dashboard concept designed for fans who want the full picture at a glance. Real-time leaderboard, track position, speed and gear telemetry, team radio and driver spotlight, all in a single bento-style layout.