The network for creativity
Join 1.25M professional creatives like you
Connect with clients, get discovered, and run your business 100% commission-free
Creatives on Contra have earned over $150M and we are just getting started
Back to feedPost
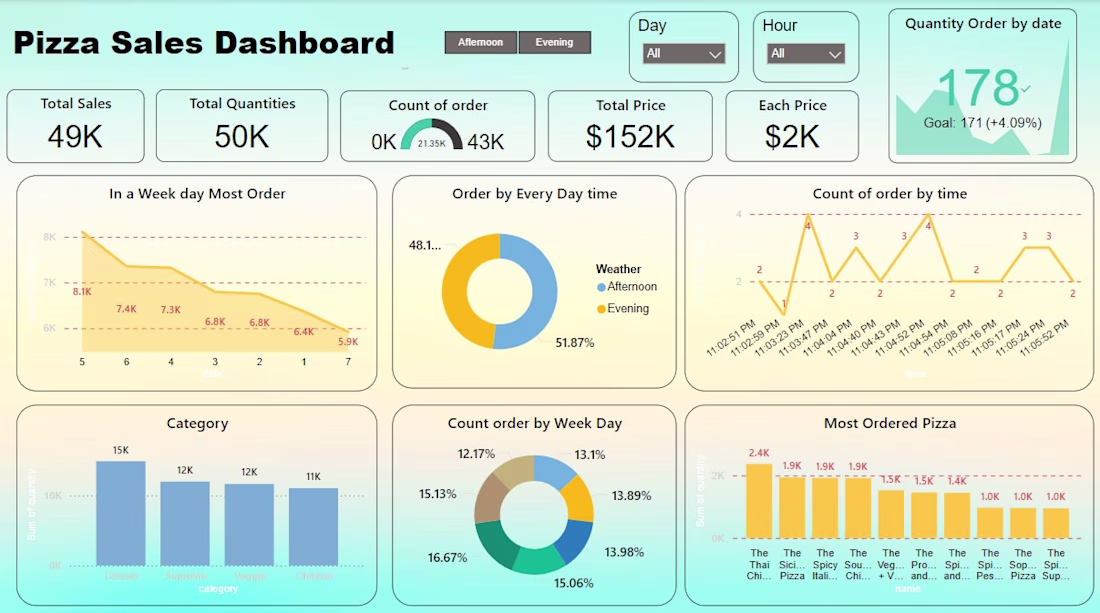
Project Title: Pizza Sales Insights Dashboard
Tools Used: Power BI | Excel | SQL | Data Cleaning
Project Overview
I transformed a complex dataset of pizza transactions into a high-impact, interactive dashboard designed to optimize restaurant operations. The goal was to identify peak ordering times, popular products, and sales trends to improve inventory management and staffing.
Key Features & Insights
Sales Performance Tracking: Real-time visibility into Total Sales ($152K) and order volumes to track growth against business goals.
Peak Time Analysis: Identified that orders peak significantly during the evening hours (51.87%), allowing for better staff scheduling.
Product Popularity: Segmented sales by category, showing that "Classic" pizzas drive the highest volume (15K orders).
Customer Behavior: Analyzed order patterns by day of the week, pinpointing high-demand days to optimize marketing spend.
The Technical Edge
To build this, I performed extensive Data Cleaning and transformation to ensure accuracy across thousands of rows. I focused on a "clean-UI" design approach to ensure that even non-technical stakeholders can find answers in seconds.
Why this matters for your business:
"Data is just numbers until you can see the story. I build dashboards that help you stop guessing and start growing based on facts."
The network for creativity
Join 1.25M professional creatives like you
Connect with clients, get discovered, and run your business 100% commission-free
Creatives on Contra have earned over $150M and we are just getting started
Related posts
Healthcare has always been complex. The dashboards built around it never made it feel any simpler until now.
CareNest is a healthcare management dashboard designed for clinicians, wellness coaches, and care teams who need every patient insight, appointment, and alert visible the moment they log in. Every interaction built to feel as calm and precise as the care it supports.
Overwhelming appointment lists. Critical alerts buried in noise. Patient flow with no visual clarity. Provider availability that takes too long to find.
Wellness progress tracking with daily and weekly views. Stress and recovery balance mapped across the full week. HRV and glucose biomarker monitoring. Patient flow capacity at a glance. Healthcare provider availability visible instantly. Aria, your personal AI assistant, answers clinical questions in real time.
A dashboard experience that matches the precision and calm that healthcare professionals need every single day. Clear. Actionable. Ready to scale.
Designing a healthcare platform, medical SaaS, or wellness dashboard that needs to feel this considered? Let's build it together.
Impressive
Dropping a new @Framer component.
A a fully customisable, animated audio visualizer.
From classic VU-meter aesthetics to live microphone-reactive visuals, and much more this single component adapts to any brand, layout, or mood.
This is good
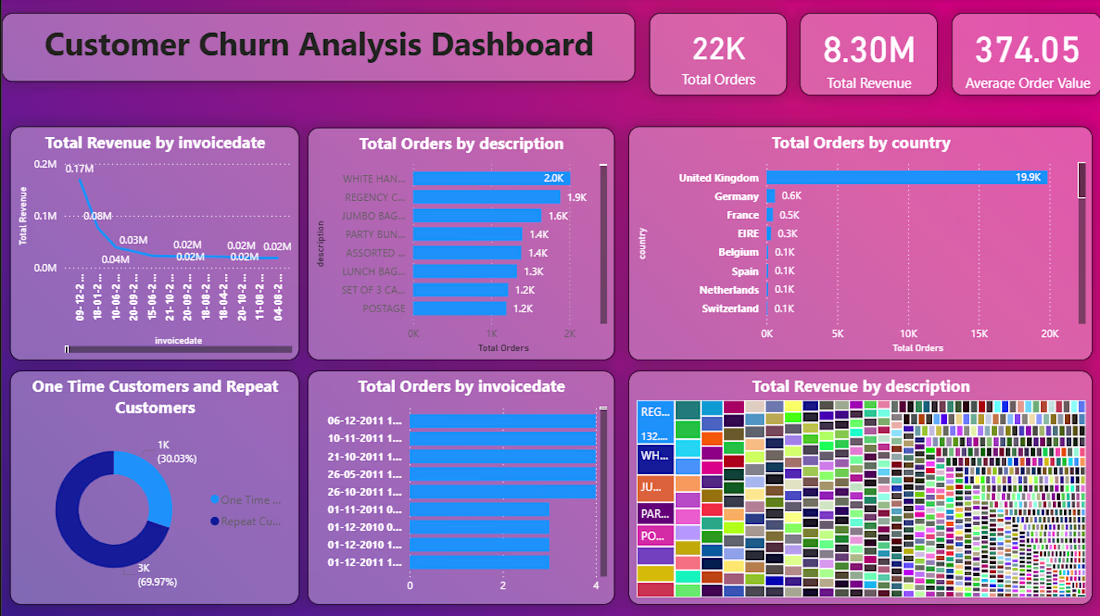
interactive Customer Churn Analysis Dashboard using Power BI to track revenue trends, customer retention, repeat purchase behavior, country-wise orders, and product performance through dynamic visualizations and KPI reporting.
Trending
Claude
Claude has entered the design space. How are you using Claude Design?
Contra University
Learn from expert creatives how to earn more using next-gen AI tools.
creativeaiflow
Creative AI workflows are evolving. What tools do you use, and what are their strengths and weaknesses?
portfolioreview
The best portfolios tell a story, not just show a grid. Share yours for feedback.
freelancerlife
Freelancer life is wins, pivots, and everything in between. What’s yours right now?