
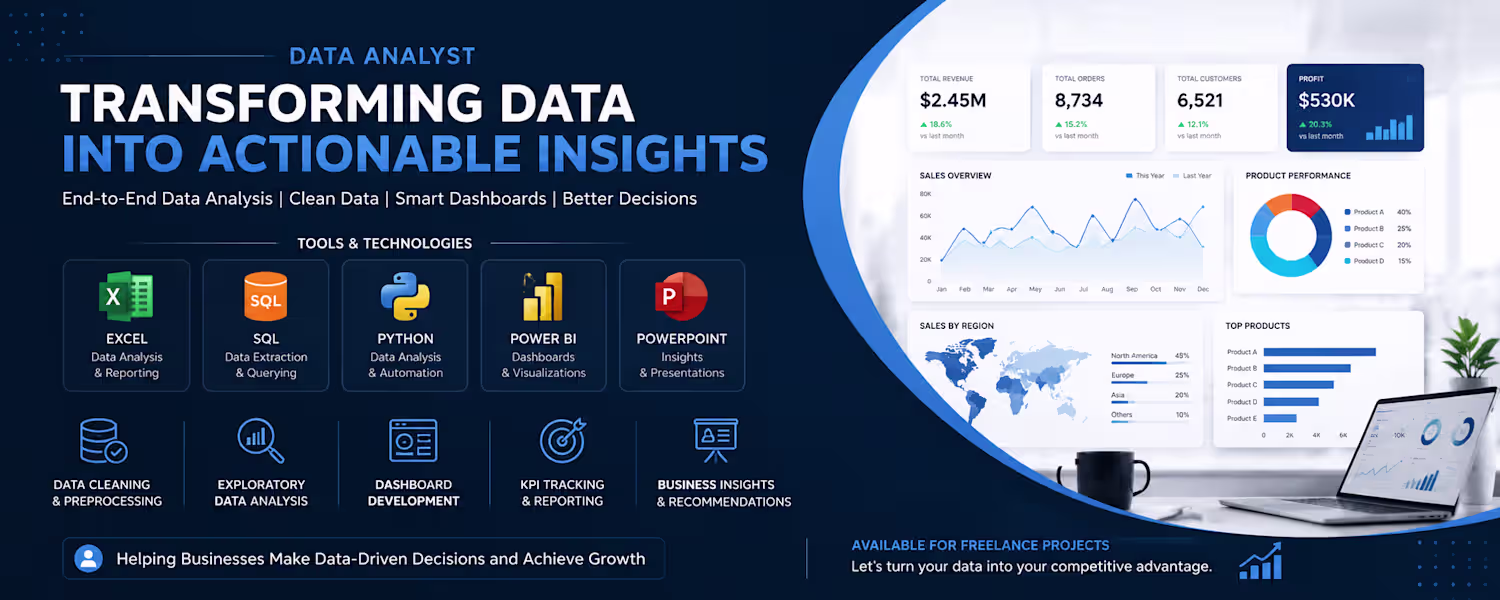
Rahul Paul
Data Analyst | Dashboards & Insights
New to Contra
Rahul is building their profile!
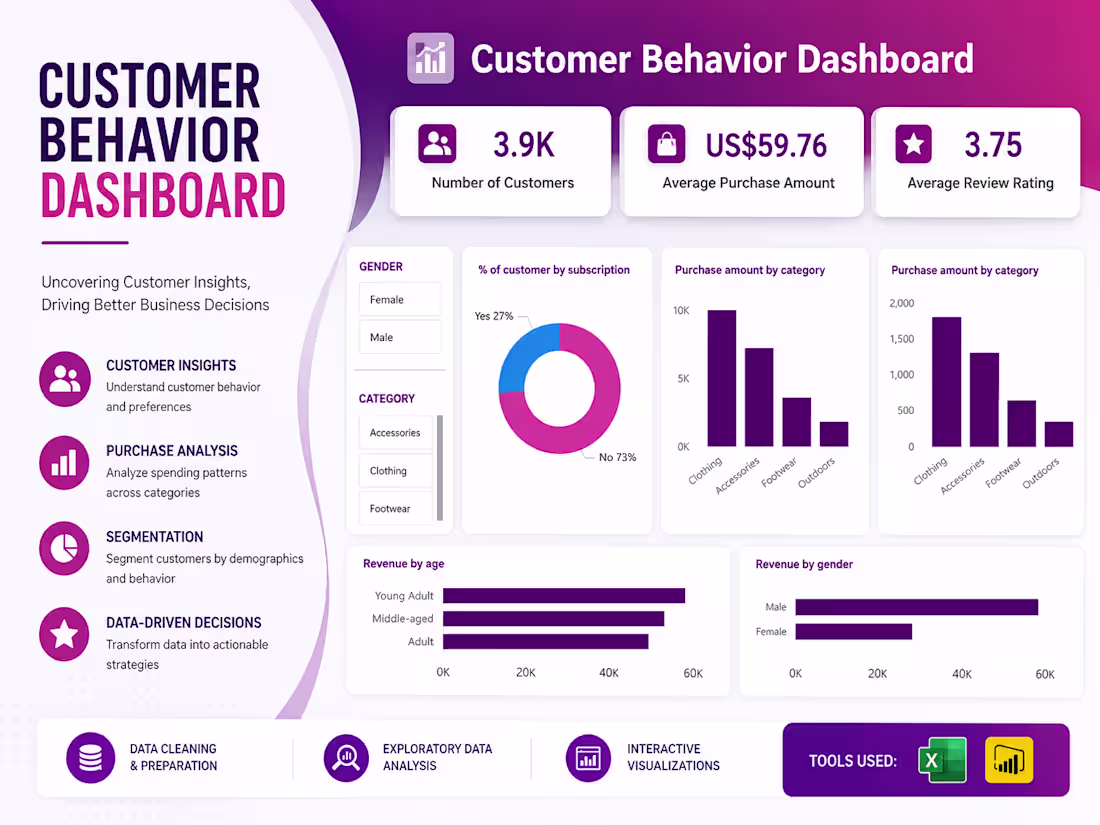
Analyzed raw data and designed an interactive Customer Behavior Dashboard using Power BI to analyze customer demographics, purchase behavior, subscription trends, category-wise revenue, and customer segmentation through dynamic KPIs and data visualizations for business decision-making.
1
54
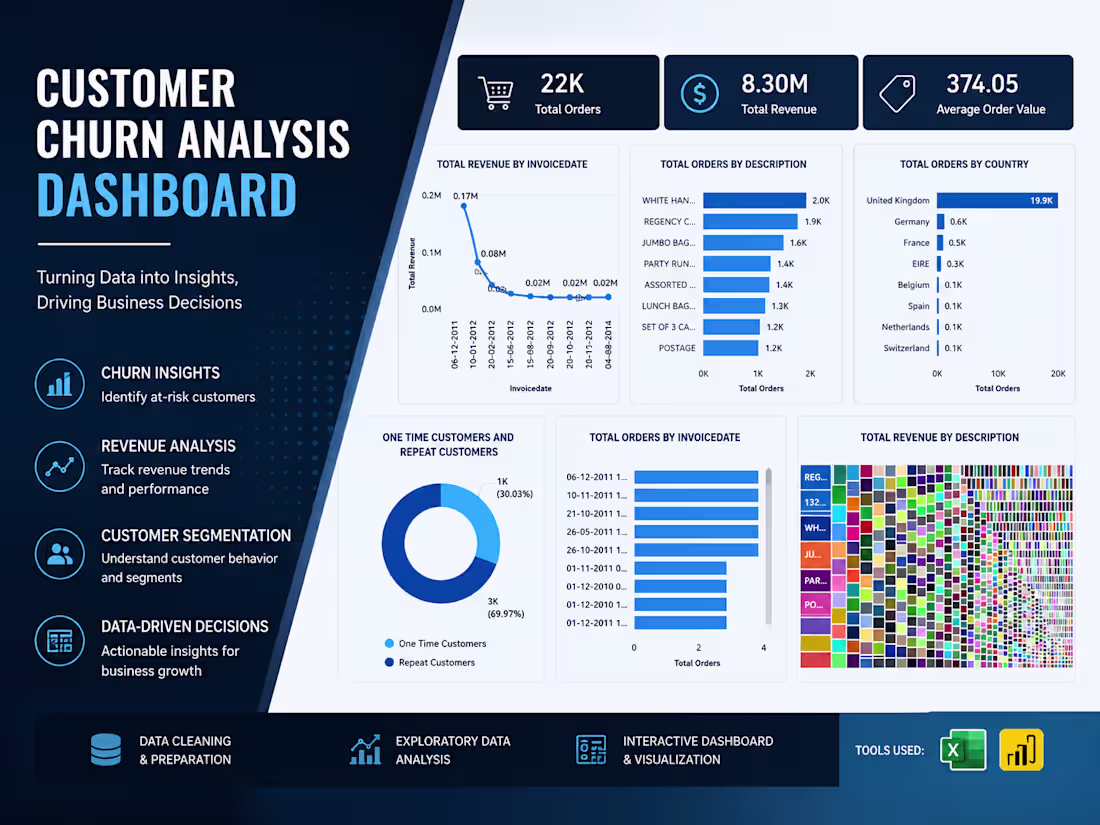
interactive Customer Churn Analysis Dashboard using Power BI to track revenue trends, customer retention, repeat purchase behavior, country-wise orders, and product performance through dynamic visualizations and KPI reporting.
1
20