The network for creativity
Join 1.25M professional creatives like you
Connect with clients, get discovered, and run your business 100% commission-free
Creatives on Contra have earned over $150M and we are just getting started
Back to feedPost
I once built a dashboard I was proud of.
Clean SQL.
Beautiful charts.
Every metric you could imagine.
And then… nobody used it.
Not because the data was wrong.
Not because the visuals were bad.
It failed because I never asked the most important question:
“What decision is this dashboard supposed to support?”
The stakeholders didn’t need 12 KPIs.
They needed one clear answer.
So I went back.
I listened more.
I removed 70% of the charts.
The new dashboard wasn’t flashy but it changed decisions.
That project taught me something I’ll never forget, which is:
Data analysis isn’t about showing how much you know. It’s about helping people act with confidence.
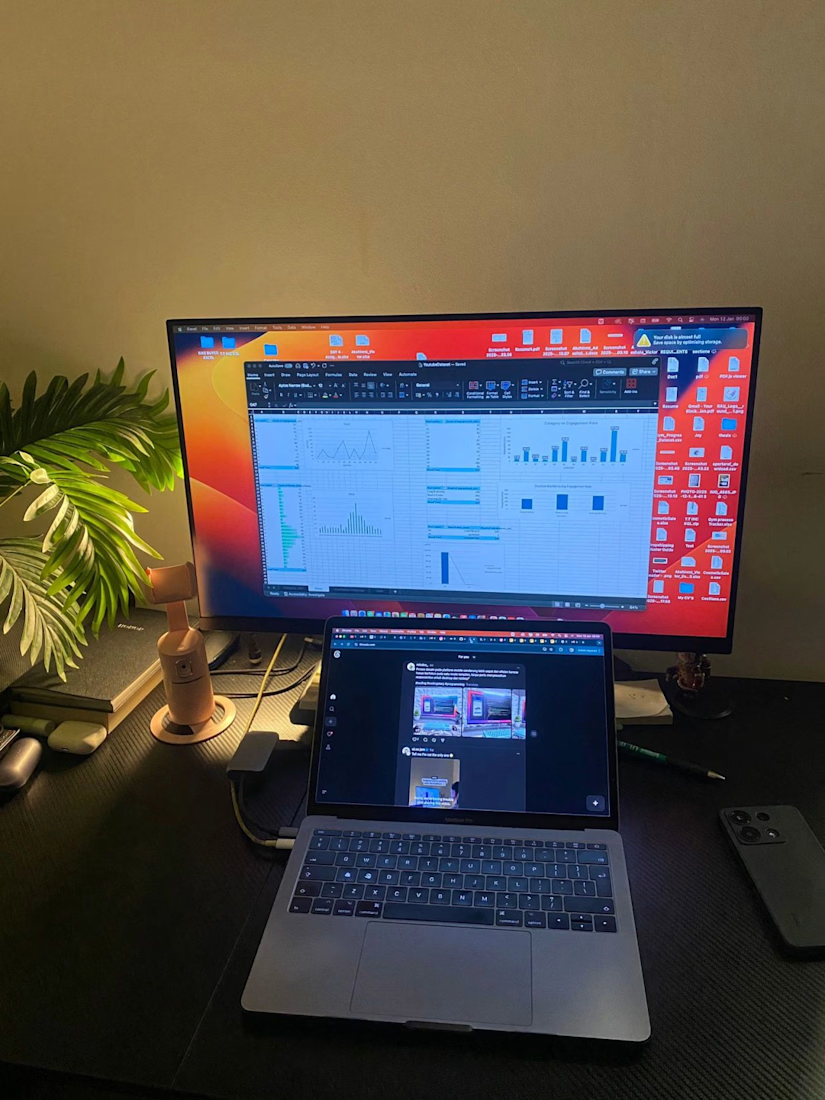
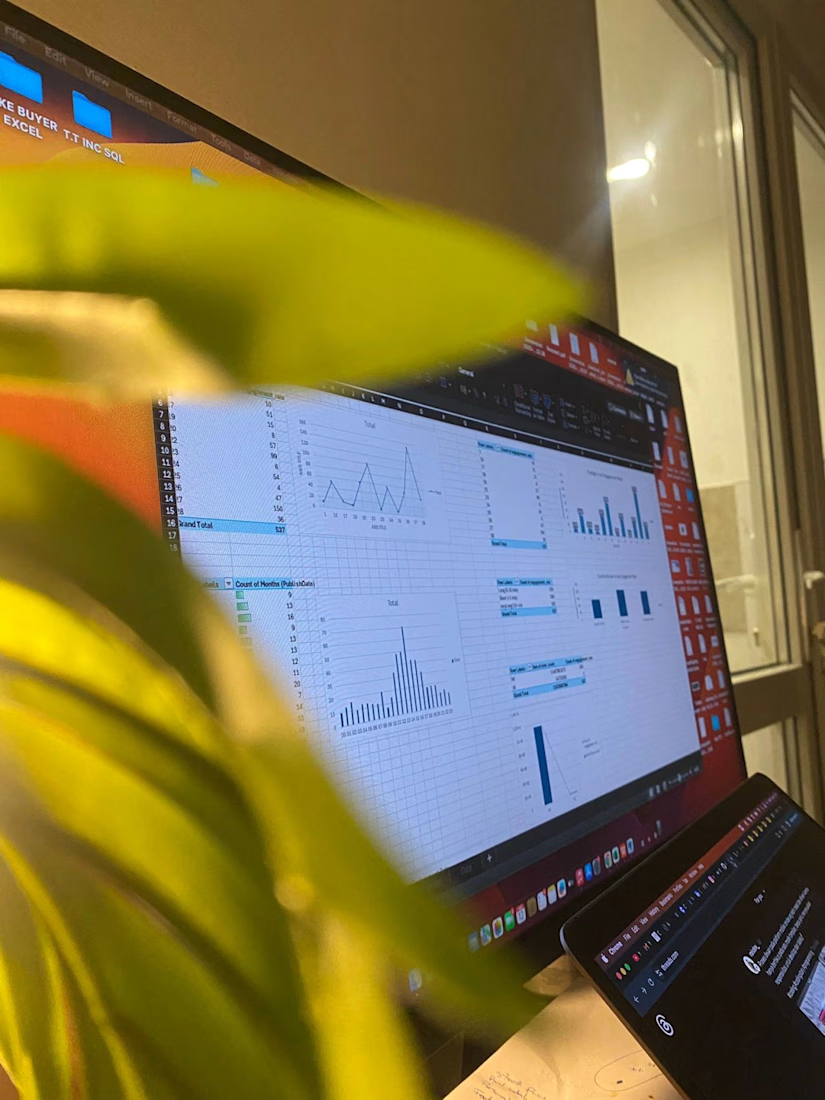

This hits the real truth most analysts learn the hard way. 👌
A dashboard succeeds or fails not on how many KPIs it shows, but on whether it guides a decision. Asking “what action should this enable?” is far more valuable than adding another chart.
Listening to stakeholders,...

Well said. The moment you start designing for decisions instead of metrics, everything changes.
Listening more and simplifying harder has consistently led to better outcomes for me too.
Absolutely agree. Once decisions become the design constraint, clarity naturally replaces complexity. Simplifying isn’t about removing value—it’s about sharpening it. Great to hear this approach has worked consistently for you as well.
The network for creativity
Join 1.25M professional creatives like you
Connect with clients, get discovered, and run your business 100% commission-free
Creatives on Contra have earned over $150M and we are just getting started







Related posts


would actually use this lol. the customizable part is what runners care about

One business problem. Three analytical routes. One data-driven story. ☕📊
I turned raw business data into actionable decisions—not just another Power BI dashboard.
For the Onyx Data October 2026 Challenge, I worked on the Sunrise Coffee Chain analytics project, analyzing store performance, profitability, customer loyalty, revenue mix, and trading patterns across 60 UK stores (2023–2024).
🔹 My Analytical Approach
1️⃣ Python — Data Preparation
Cleaned and prepared the source datasets to establish a reliable foundation for analysis.
2️⃣ SQL — Business Analysis
Investigated store-level profitability, cost pressure, customer loyalty, revenue contribution, and trading patterns.
3️⃣ Power BI — Interactive Dashboards
Built a 3-page interactive report featuring advanced DAX measures, KPI cards, YoY comparisons, profitability analysis, and business-focused visualizations.
📊 Key Findings
• £89.7M Revenue | £16.9M Net Profit
The business recorded an aggregate net profit margin of 18.8% across the analysis period.
• Store Location Matters
Transport-Hub stores achieved a 25.1% aggregate net profit margin, compared with 18.6% for High-Street stores.
• An Area Requiring Attention
South London Corner recorded a £50.5K net loss over 24 months.
• Product Revenue Contribution
Espresso contributed 45.7% of daily revenue, while food contributed 26.1%.
• Trading Patterns
Average daily revenue was approximately 24% lower on weekends and 33% lower on UK bank holidays than on regular trading days.
💡 My Biggest Takeaway
Revenue alone does not tell the whole story. Understanding profitability, cost pressure, product contribution, and trading patterns helps businesses identify where to improve performance and make better decisions.
🔗 Explore the Complete Project
GitHub: https://github.com/SajeebTheAnalyst/sunrise-coffee-chain-analytics
If you were advising the management team, which finding would you investigate first—and why?
#DataAnalytics #SQL #PowerBI #Python #DAX #BusinessIntelligence #DataVisualization #OnyxData


I would investigate South London Corner first. Break the 24-month loss into store-month revenue, direct costs and allocated costs, then compare it with similar stores over matched trading periods. Reconcile at store-month grain before joining product or loyalty tables so a...

Project Management Dashboard UI – A powerful and intuitive interface designed to enhance team collaboration, productivity, and workflow efficiency.


the yellow date card gives the eye a clear place to start, which most dashboards skip. how does the to-do list hold up when someone has 30 tasks instead of 5?


