The network for creativity
Join 1.25M professional creatives like you
Connect with clients, get discovered, and run your business 100% commission-free
Creatives on Contra have earned over $150M and we are just getting started
Back to feedPost
IPL Sports Data Analytics & Performance Dashboard (Excel)
An interactive sports analytics dashboard designed in Microsoft Excel to analyze Indian Premier League (IPL) match data and historical trends.
Key Insights :
Total matches played over time and season-wise performance trends.
Detailed analysis of toss decisions (Bat vs. Field) and their impact on match outcomes.
Top-performing teams, stadiums with highest match counts, and historical victory metrics.
Built using dynamic Pivot Tables, advanced formulas, custom charts, and interactive slicers for seamless data exploration.
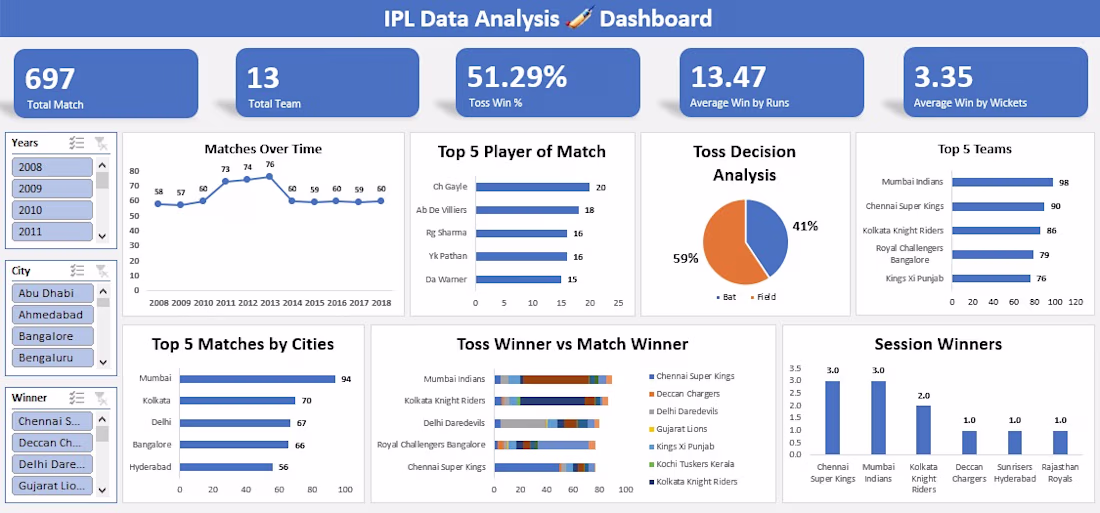
The toss decision analysis is such a smart angle — that 59% vs 41% split tells a story most people overlook. Love how the slicers make it easy to explore by city and year. Clean, well-structured work!
Thanks for the feedback, Geethasree! Appreciate you noticing the toss analysis detail. 😊
The network for creativity
Join 1.25M professional creatives like you
Connect with clients, get discovered, and run your business 100% commission-free
Creatives on Contra have earned over $150M and we are just getting started
Related posts
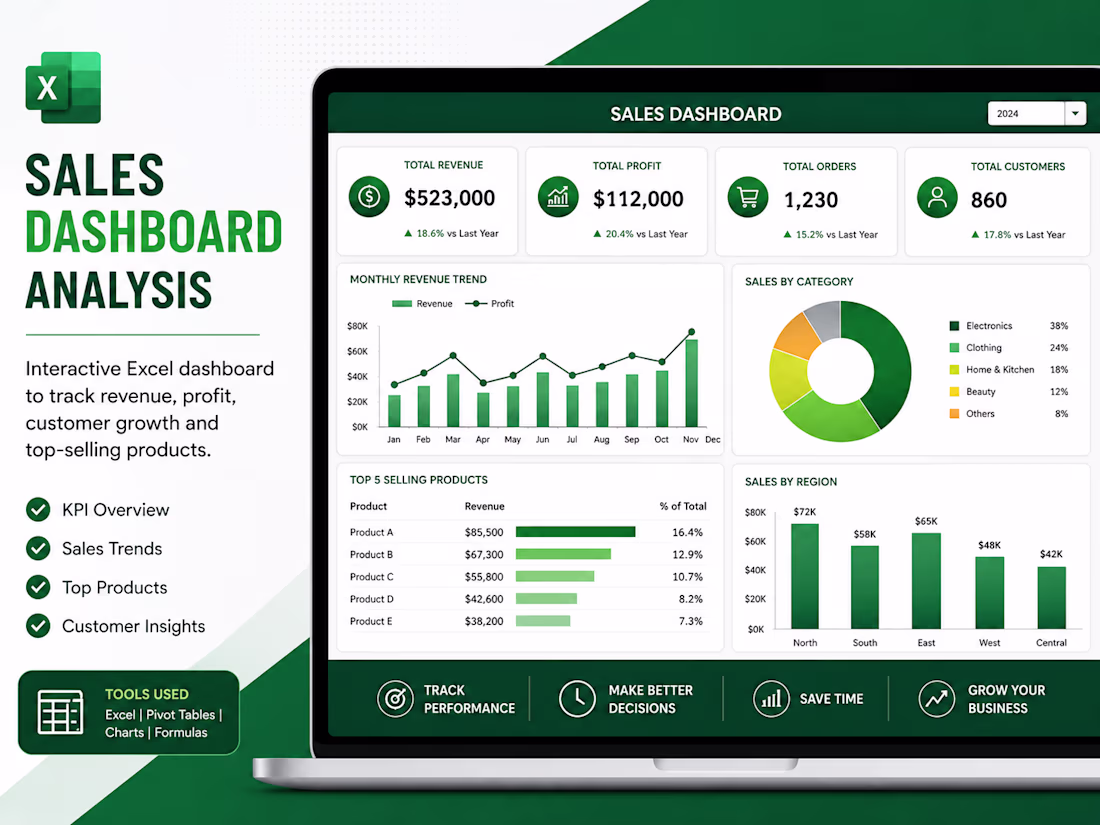
This project focuses on creating a professional and interactive Excel Sales Dashboard that helps businesses understand their sales performance through clear visual reporting. The dashboard tracks important metrics such as monthly revenue, profit growth, customer performance, and top-selling products in a simple and organized format.
Using Pivot Tables, charts, KPI cards, and advanced Excel formulas, the raw business data was transformed into meaningful insights that support faster and smarter decision-making. The dashboard was designed with a clean layout so business owners and teams can easily monitor trends, compare performance, and identify growth opportunities.
This type of dashboard is especially useful for small businesses, ecommerce stores, startups, and sales teams that want accurate reporting without spending hours on manual analysis.
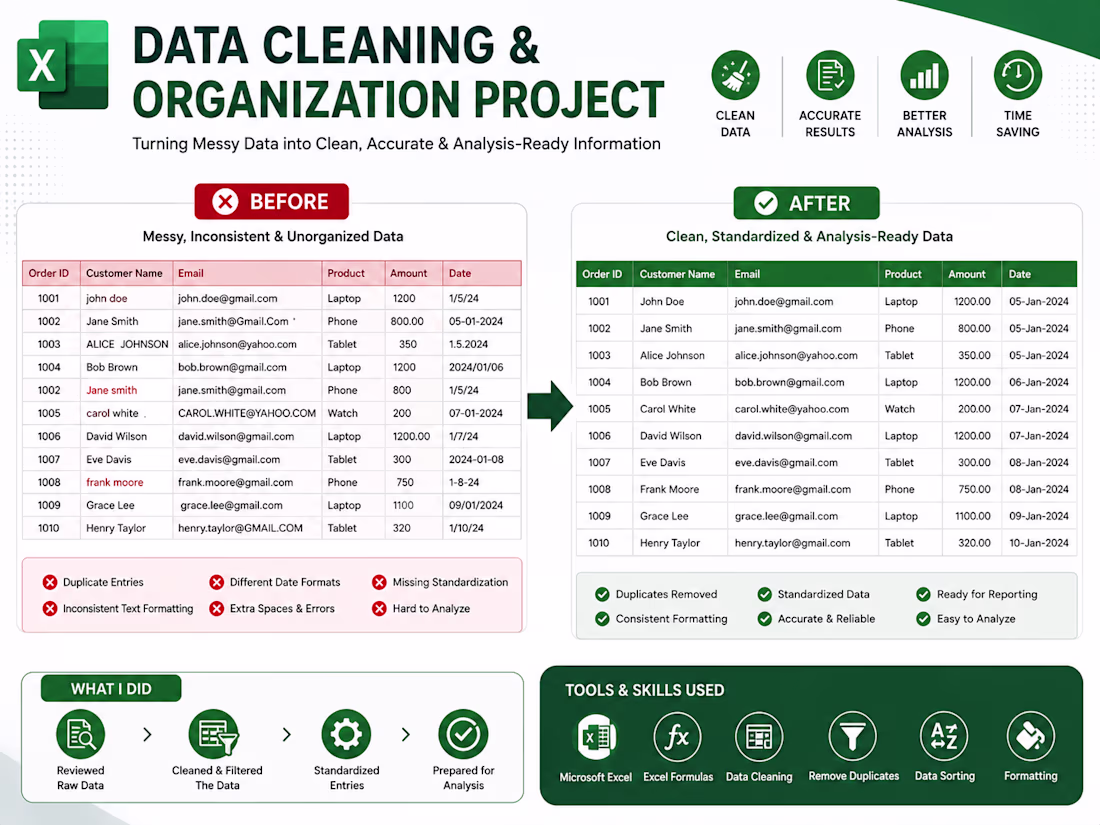
This project focuses on cleaning and organizing raw business data to make it accurate, structured, and ready for reporting and analysis. The original dataset contained duplicate records, inconsistent formatting, missing standardization, extra spaces, and mixed date formats, which made the data difficult to analyze effectively.
Using Microsoft Excel tools and formulas, the data was cleaned by removing duplicates, correcting formatting issues, standardizing entries, organizing columns, and improving overall consistency. The cleaned dataset was then prepared for dashboards, reporting, and business analysis.
The before-and-after comparison clearly demonstrates how messy and unstructured data can be transformed into professional, analysis-ready information. This type of work helps businesses save time, reduce errors, and improve the accuracy of their reporting and decision-making processes.
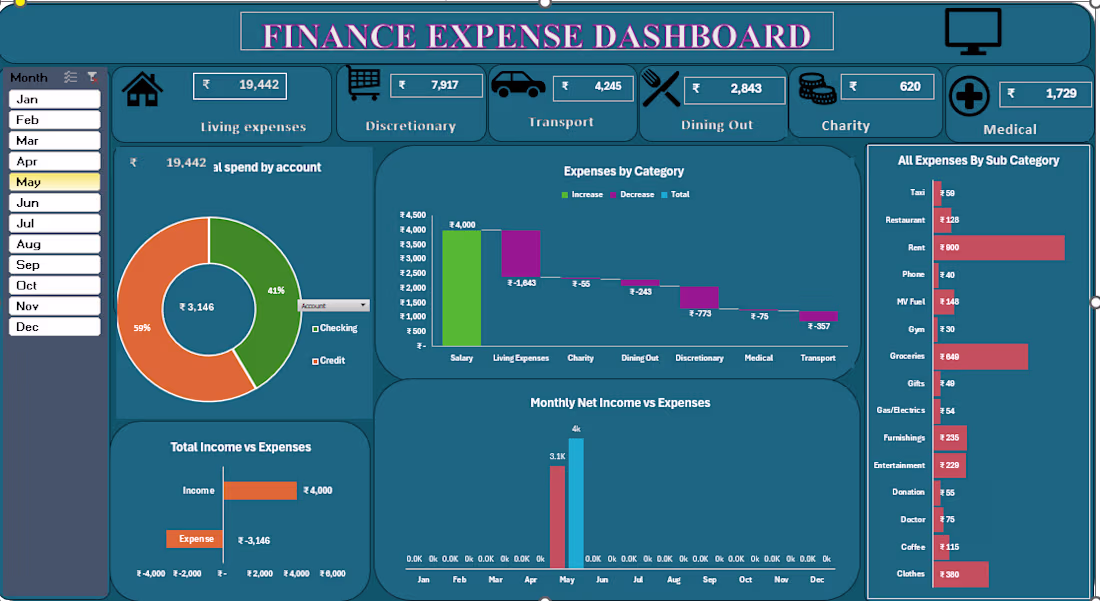
Built a finance expense dashboard using Excel to track income, expenses, and category-wise spending in a simple, visual way.
Turned raw data into clear insights like savings trends, spending patterns, and monthly breakdowns.
Always improving my Excel and data visualisation skills through real projects.
Trending
Claude
Claude has entered the design space. How are you using Claude Design?
Contra University
Learn from expert creatives how to earn more using next-gen AI tools.
creativeaiflow
Creative AI workflows are evolving. What tools do you use, and what are their strengths and weaknesses?
portfolioreview
The best portfolios tell a story, not just show a grid. Share yours for feedback.
freelancerlife
Freelancer life is wins, pivots, and everything in between. What’s yours right now?