The network for creativity
Join 1.25M professional creatives like you
Connect with clients, get discovered, and run your business 100% commission-free
Creatives on Contra have earned over $150M and we are just getting started
Back to feedPost
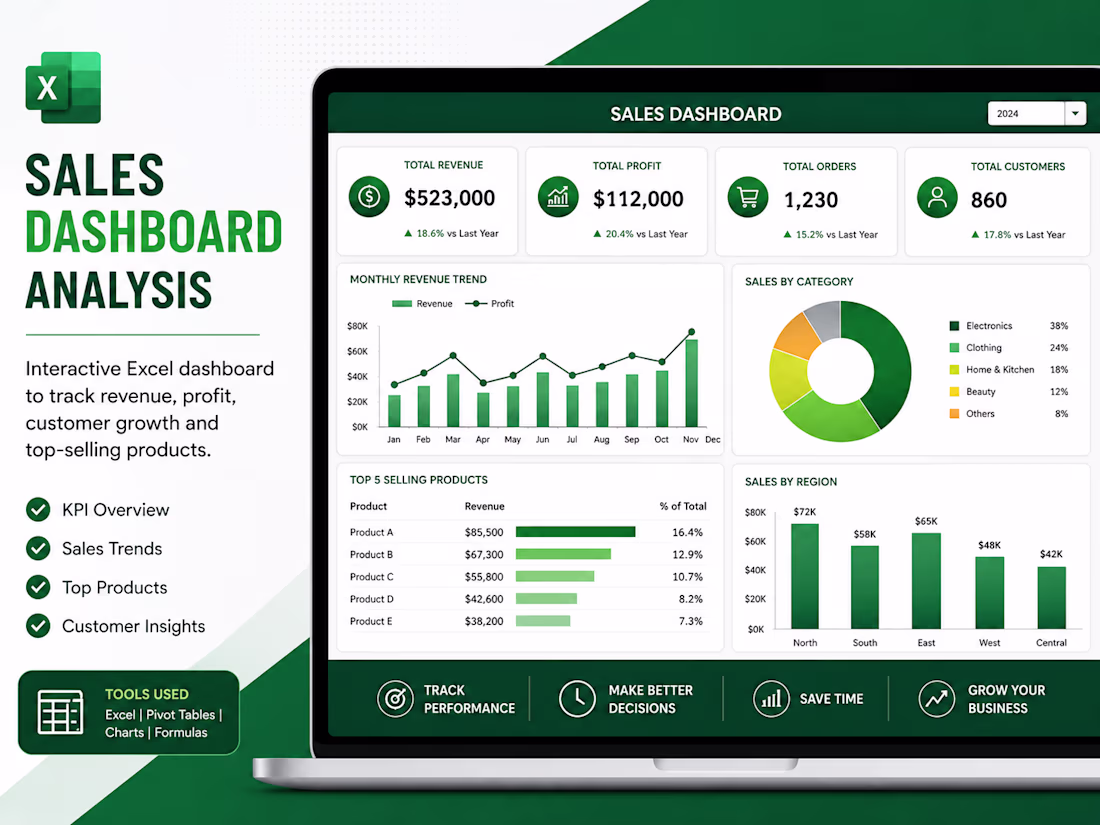
This project focuses on creating a professional and interactive Excel Sales Dashboard that helps businesses understand their sales performance through clear visual reporting. The dashboard tracks important metrics such as monthly revenue, profit growth, customer performance, and top-selling products in a simple and organized format.
Using Pivot Tables, charts, KPI cards, and advanced Excel formulas, the raw business data was transformed into meaningful insights that support faster and smarter decision-making. The dashboard was designed with a clean layout so business owners and teams can easily monitor trends, compare performance, and identify growth opportunities.
This type of dashboard is especially useful for small businesses, ecommerce stores, startups, and sales teams that want accurate reporting without spending hours on manual analysis.
The network for creativity
Join 1.25M professional creatives like you
Connect with clients, get discovered, and run your business 100% commission-free
Creatives on Contra have earned over $150M and we are just getting started
Related posts
Healthcare has always been complex. The dashboards built around it never made it feel any simpler until now.
CareNest is a healthcare management dashboard designed for clinicians, wellness coaches, and care teams who need every patient insight, appointment, and alert visible the moment they log in. Every interaction built to feel as calm and precise as the care it supports.
Overwhelming appointment lists. Critical alerts buried in noise. Patient flow with no visual clarity. Provider availability that takes too long to find.
Wellness progress tracking with daily and weekly views. Stress and recovery balance mapped across the full week. HRV and glucose biomarker monitoring. Patient flow capacity at a glance. Healthcare provider availability visible instantly. Aria, your personal AI assistant, answers clinical questions in real time.
A dashboard experience that matches the precision and calm that healthcare professionals need every single day. Clear. Actionable. Ready to scale.
Designing a healthcare platform, medical SaaS, or wellness dashboard that needs to feel this considered? Let's build it together.
Impressive
Modern data analytics platform UI designed to simplify complex insights through clean visualisation and intelligent workflows.
Ring Data delivers a seamless experience for monitoring performance, analysing metrics, and making faster data-driven decisions.
#DataAnalytics #DashboardDesign #UIUX #DataVisualization
Great work🔥👏👏
Trending
Claude
Claude has entered the design space. How are you using Claude Design?
Contra University
Learn from expert creatives how to earn more using next-gen AI tools.
creativeaiflow
Creative AI workflows are evolving. What tools do you use, and what are their strengths and weaknesses?
portfolioreview
The best portfolios tell a story, not just show a grid. Share yours for feedback.
freelancerlife
Freelancer life is wins, pivots, and everything in between. What’s yours right now?