The network for creativity
Join 1.25M professional creatives like you
Connect with clients, get discovered, and run your business 100% commission-free
Creatives on Contra have earned over $150M and we are just getting started
Back to feedPost

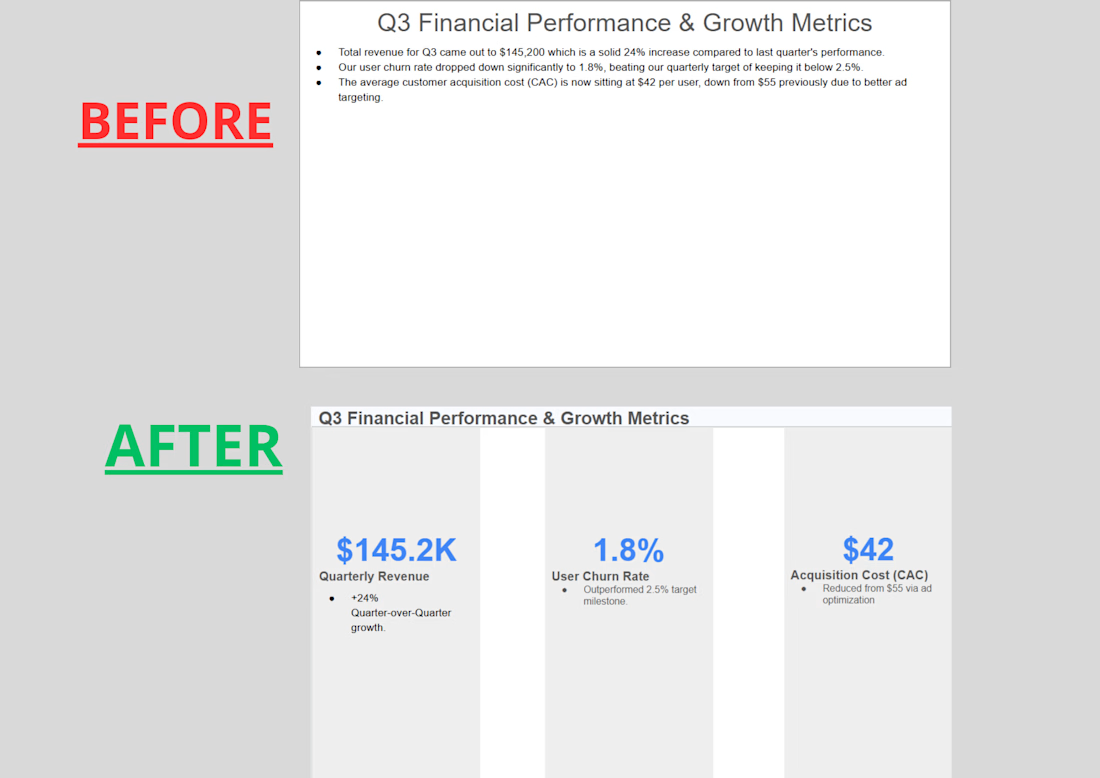
B2B Presentation Data Dashboard Optimization Case Study
The Challenge: The client's original Q3 performance slide relied on dense, text-heavy paragraphs that buried the key financial achievements.
The Solution: I restructured the layout into a clean, executive 3-column metric grid.
The Impact: Amplified core sales and revenue metrics ($145.2K Revenue, 1.8% Churn, $42 CAC) using a bold corporate blue color accent. Stripped away conversational filler text to deliver an instantly scannable, pitch-ready dashboard.


The network for creativity
Join 1.25M professional creatives like you
Connect with clients, get discovered, and run your business 100% commission-free
Creatives on Contra have earned over $150M and we are just getting started





Related posts

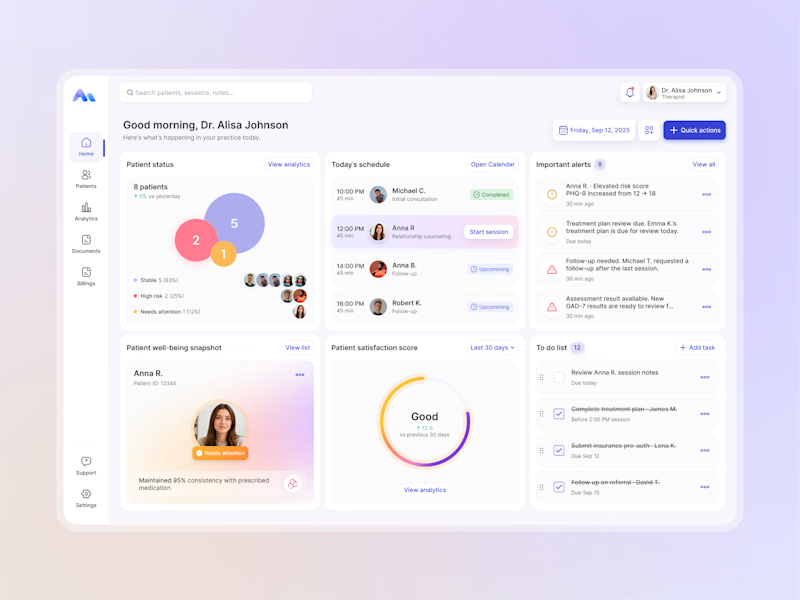
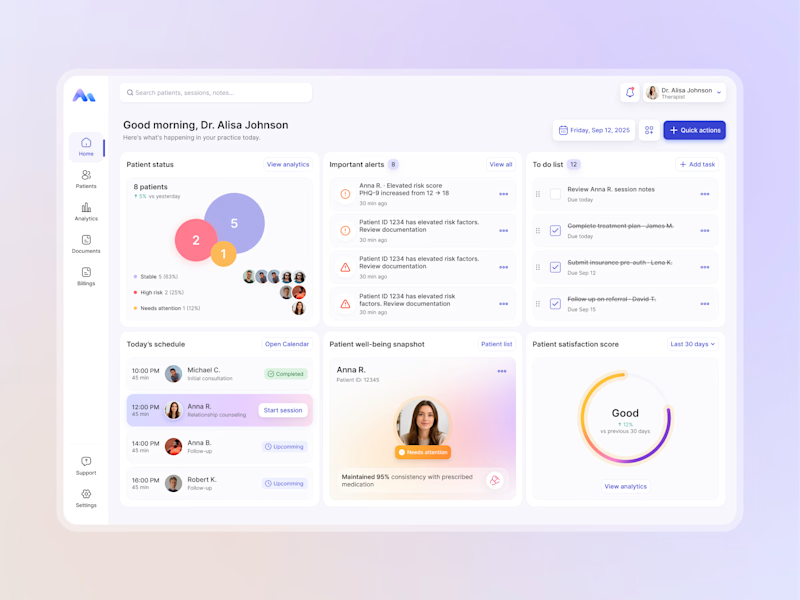
Designing for therapists means prioritizing what matters in the next few minutes, not just what looks good on a dashboard.
I explored two layout directions for a mental health practice management web app that helps psychologists manage sessions, patients, documentation, tasks, and follow-ups.
Both concepts use the same core widgets, but with different positioning and visual hierarchy. The goal was to make daily priorities easier to scan and act on.
Which option feels more intuitive - A or B? 🤔
17 voted
68%
8 voted
32%
25 votes
Closed


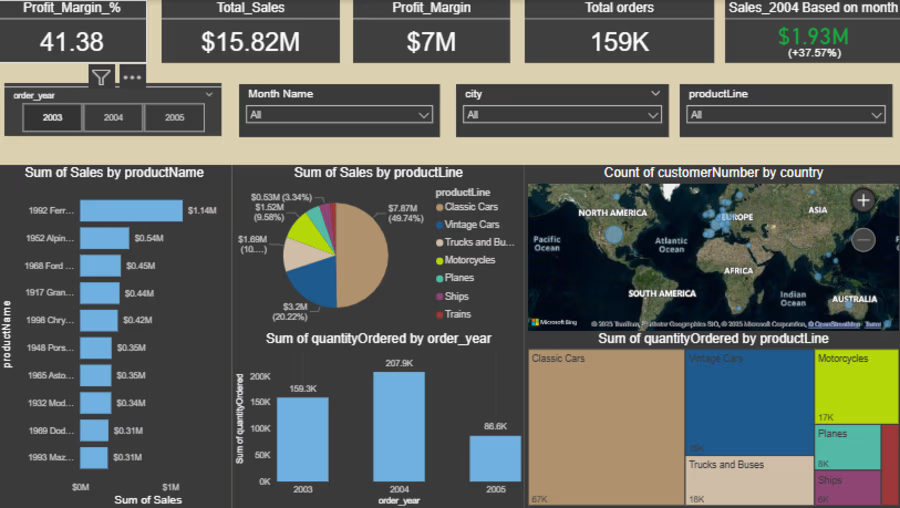
I Created Microsoft Power BI Dashboard By using many of the Tools
🚀 Data Modelling
🧠 Data Visualization
🚀 Group By
🧠 Data Cleaning




What if anyone on your team could ask your data a question and get a live dashboard back in under a minute?
That was the brief. Business users were locked out of their own data. Every question waited on someone who could write SQL, data sat across disconnected systems, and security teams refused to send sensitive records to third-party AI tools.
So we flipped the model. Instead of moving enterprise data to an AI product, we moved the AI analytics product into the customer's AWS account.
What we built:
• Natural-language querying that turns plain-English questions into governed dashboards in under 60 seconds
• Federated queries across SQL and NoSQL sources through Trino
• AI query generation on AWS Bedrock Agents, with Bedrock Guardrails keeping model output in bounds
• Dashboards generated with Apache Superset, plus proactive anomaly and trend alerts
• A white-label React widget that embeds in any product
• Role-based access, row-level security and enterprise SSO enforced at every layer
The result:
Zero data egress. The whole platform deploys inside the customer's VPC and is live on AWS Marketplace.
Building AI features for a data-heavy or regulated product? Let's talk about doing it without your data leaving your cloud.
