The network for creativity
Join 1.25M professional creatives like you
Connect with clients, get discovered, and run your business 100% commission-free
Creatives on Contra have earned over $150M and we are just getting started
Back to feedPost

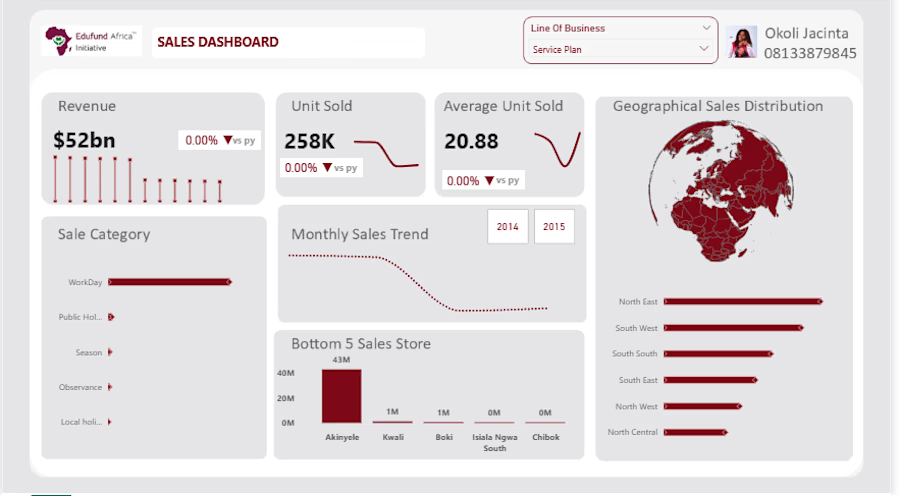
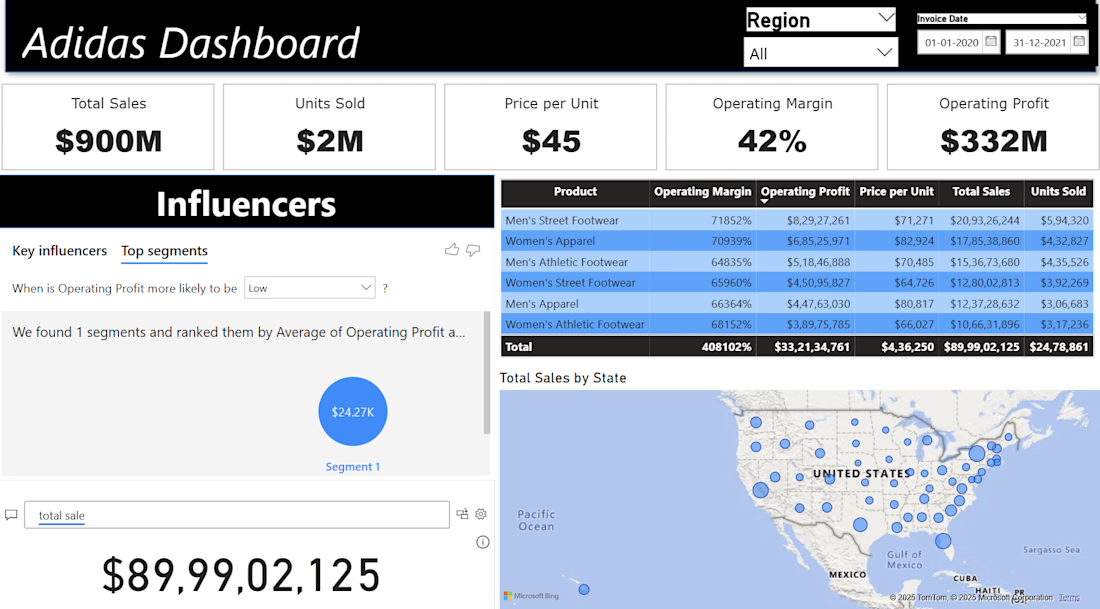
Sales Performance Dashboard | Power BI
Designed and developed an interactive sales analytics dashboard to help stakeholders monitor revenue, customer growth, product performance, and regional sales trends in one centralized view.
Tools Used:
- Power BI
-Power Query
- DAX
- PowerPoint (wireframing and dashboard planning)
My Contributions:
- Imported and transformed raw sales data using Power Query.
- Built a star schema data model by creating relationships between fact and dimension tables.
Developed DAX measures for:
- Total Sales ($105M)
- Total Quantity Sold (6M units)
- Total Customers (9,191)
- Average Unit Price ($17.6)
- Created Previous Year (PY) metrics and Year-over-Year growth calculations for sales, quantity, and customers.
- Implemented conditional formatting with dynamic color indicators to highlight performance changes.
Dashboard Features:
- Geographic sales analysis using Shape Maps.
- Monthly trends for sales, quantity, pricing, and customer acquisition.
- Customer segment analysis using donut charts.
- Product and country performance rankings using stacked bar charts.
- Interactive filtering for business units and service plans.
Business Impact:
The dashboard provides decision-makers with a single source of truth for tracking sales performance, customer behavior, and regional trends, enabling faster and more informed business decisions.
Data VisualizationMicrosoft Power BIBusiness AnalysisData AnalysisMicrosoft ExcelMicrosoft PowerPoint


The network for creativity
Join 1.25M professional creatives like you
Connect with clients, get discovered, and run your business 100% commission-free
Creatives on Contra have earned over $150M and we are just getting started
Trending
retrofuturism
Share your favorite designs from the past exploring the distant future. Or your own take on the aesthetic 🚀
halftone
Dots. Texture. Grain. Let's see your designs using the halftone technique.

Midjourney
Creatives are showing off what they're making with Midjourney.
colorgrade
Video editors sound off: How do you enhance the mood of your video in color grading?





Related posts

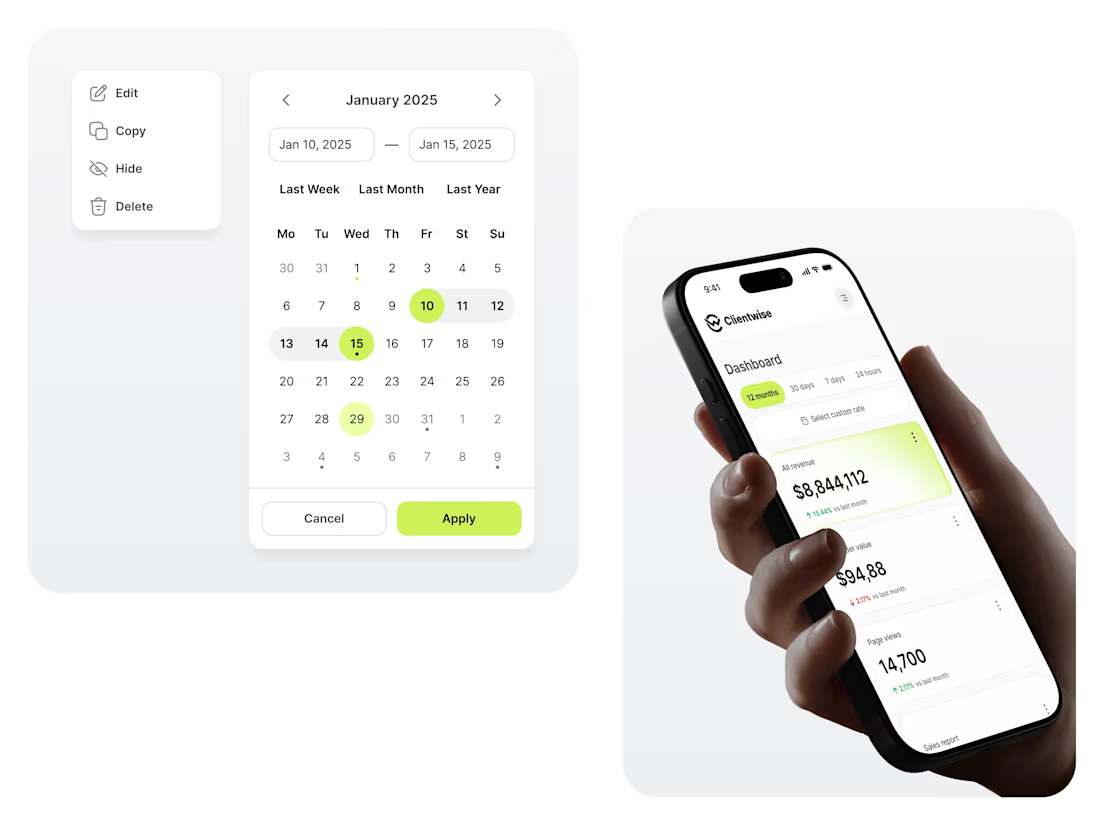
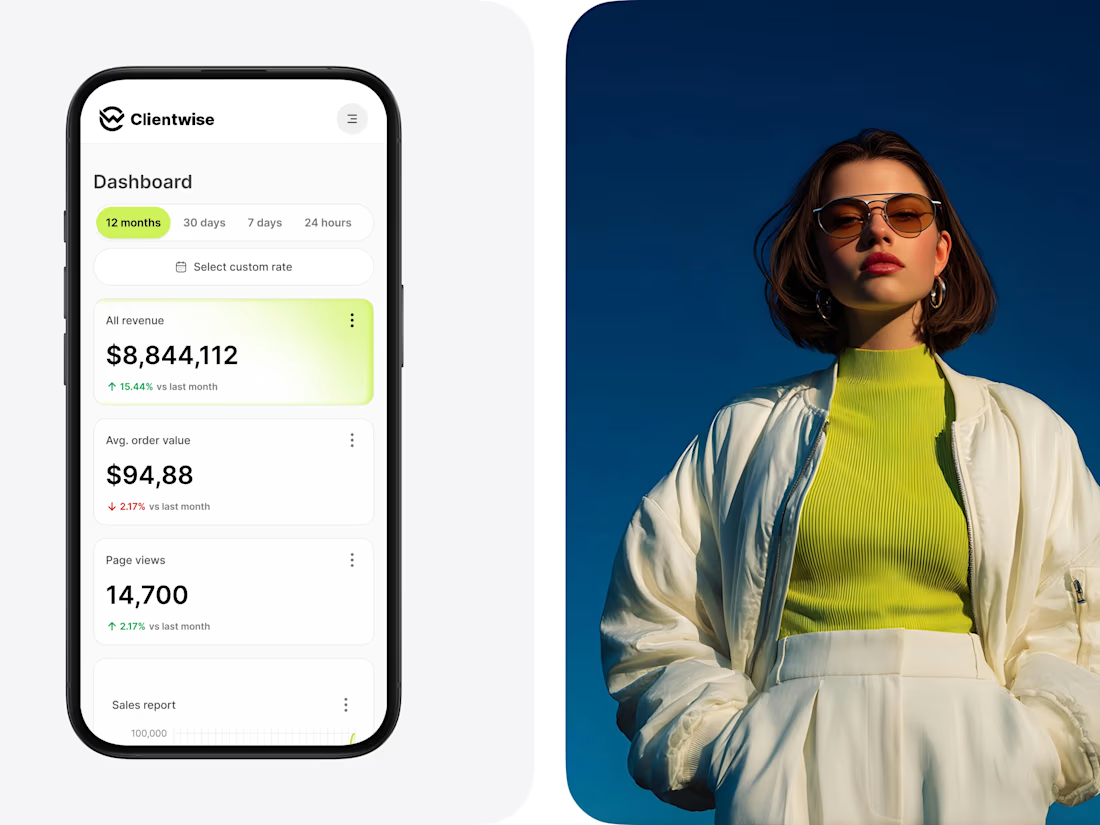
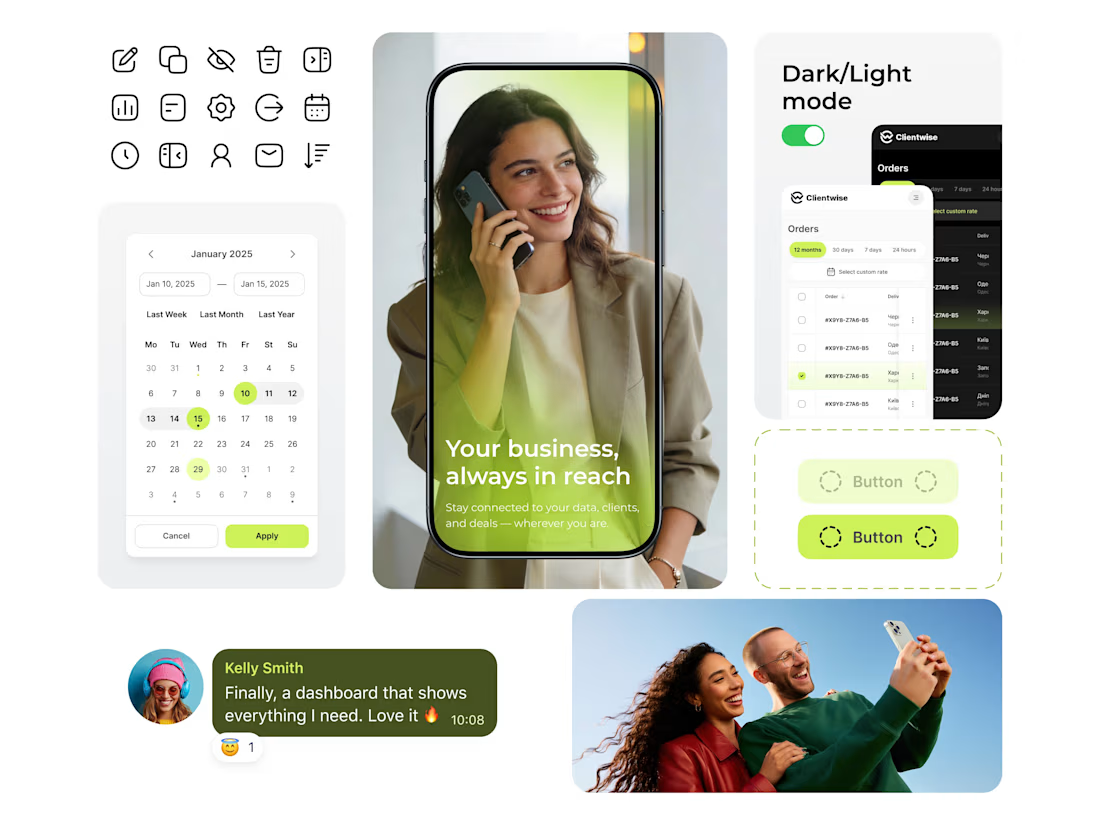
Clientwise — Mobile Analytics & Business Dashboard UI/UX
Exciting to share a fresh iteration for Clientwise — a modern mobile analytics platform designed for business owners, founders, and decision-makers who need instant clarity on their metrics on the go. ⚡️
🎯 Key Features & Highlights:
Data Visualization at a Glance: Real-time revenue tracking, order value breakdowns, and growth trends delivered in a high-contrast layout.
Adaptive Design System: Clean component architecture including custom date pickers, crisp micro-icons, and dual-mode theme support (Light & Dark).
User-Centric UX: Streamlined navigation allowing users to filter custom date ranges and monitor client insights seamlessly.
Designed in Figma with a strong focus on typography, modern contrast, and scalable UI components.
💬 How do you approach dual-theme accessibility in data-heavy mobile apps? Would love to hear your thoughts in the comments!
🚀 Available for new product design opportunities & project collaborations.



Great work!

Built an interactive Power BI dashboard to analyze sales, customer trends, and regional metrics using DAX and data modelling. Enabled faster decision-making for inventory, marketing, and revenue optimization with dynamic filters and KPIs.

My core stack is less "generate pretty pictures" and more "build the pipeline that does the thinking":
n8n — the glue. Great for orchestrating multi-step agent workflows and connecting APIs without writing a service from scratch. Weakness: gets messy fast on complex branching logic, and debugging a broken node chain eats time.
RAG (usually with a vector DB + LangChain-style retrieval) — lets me ground LLM output in actual client data instead of hallucinated generalities. Strength: dramatically improves accuracy for domain-specific asks. Weakness: chunking/retrieval quality is finicky, and a bad embedding setup silently tanks results without throwing an error.
Claude/GPT for reasoning + code — my default for anything needing judgment: analysis writeups, SQL/Python generation, proposal drafting. Strength: fast iteration. Weakness: still needs a human check on numbers — confident-sounding ≠ correct.
Power BI / Tableau — where the AI output actually becomes something a client trusts. AI can shortcut the analysis, but the dashboard is what gets signed off on.
The honest lesson: the "AI" part is maybe 30% of the workflow. The rest is validation, data plumbing, and making the output legible to a non-technical stakeholder.



Silent failures are what I watch closest. I treat an answer as untrusted unless I can show exactly which source text the model read, because fluent output can hide a bad match.