The network for creativity
Join 1.25M professional creatives like you
Connect with clients, get discovered, and run your business 100% commission-free
Creatives on Contra have earned over $150M and we are just getting started
Back to feedPost


The network for creativity
Join 1.25M professional creatives like you
Connect with clients, get discovered, and run your business 100% commission-free
Creatives on Contra have earned over $150M and we are just getting started








Related posts

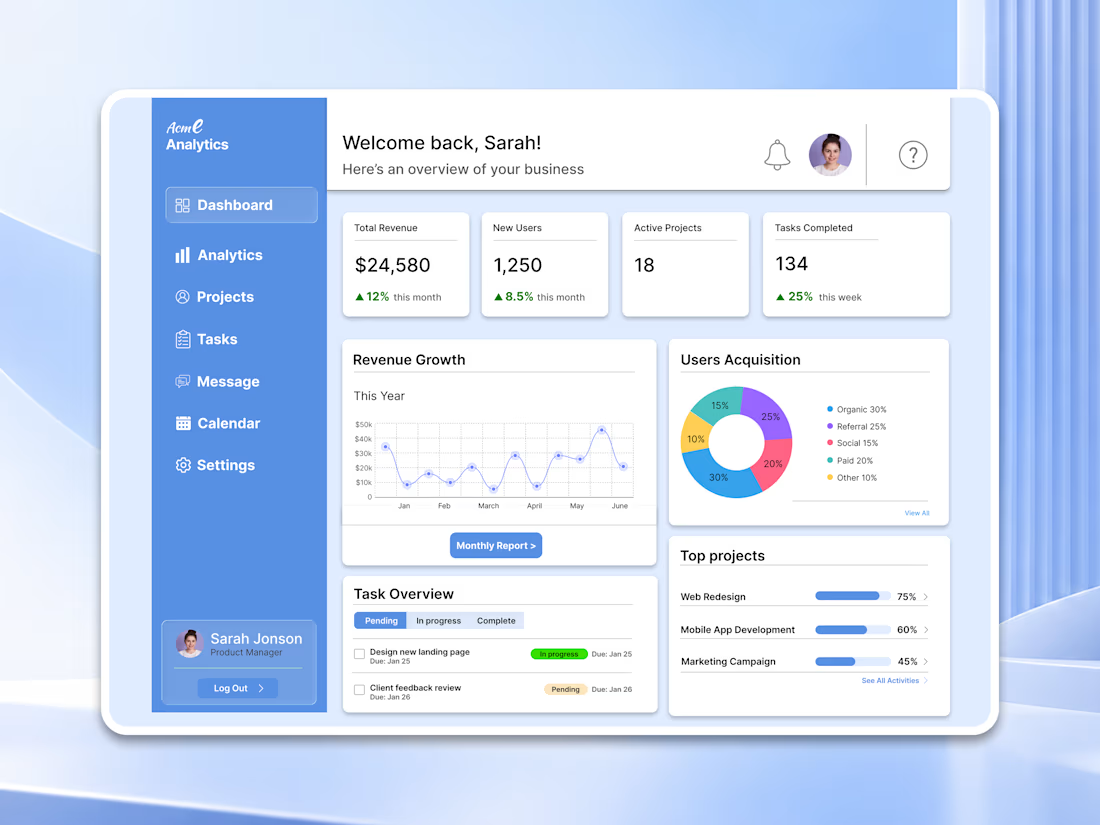
Working on a SaaS dashboard concept in Figma. 🚀
The goal is to make complex business data easier to scan and understand through clear visual hierarchy, structured analytics cards, and organized navigation.
Still refining the details and exploring ways to make the experience more intuitive.
What matters more to you in a dashboard: clean visuals or faster access to insightful?
#Ui designs #Ux design #Saas design #Figma

For a dashboard like this, I’d test whether the key action stays visible when the cards are filled with real, uneven data—not just placeholder numbers. What kind of business data are you designing the first view around?

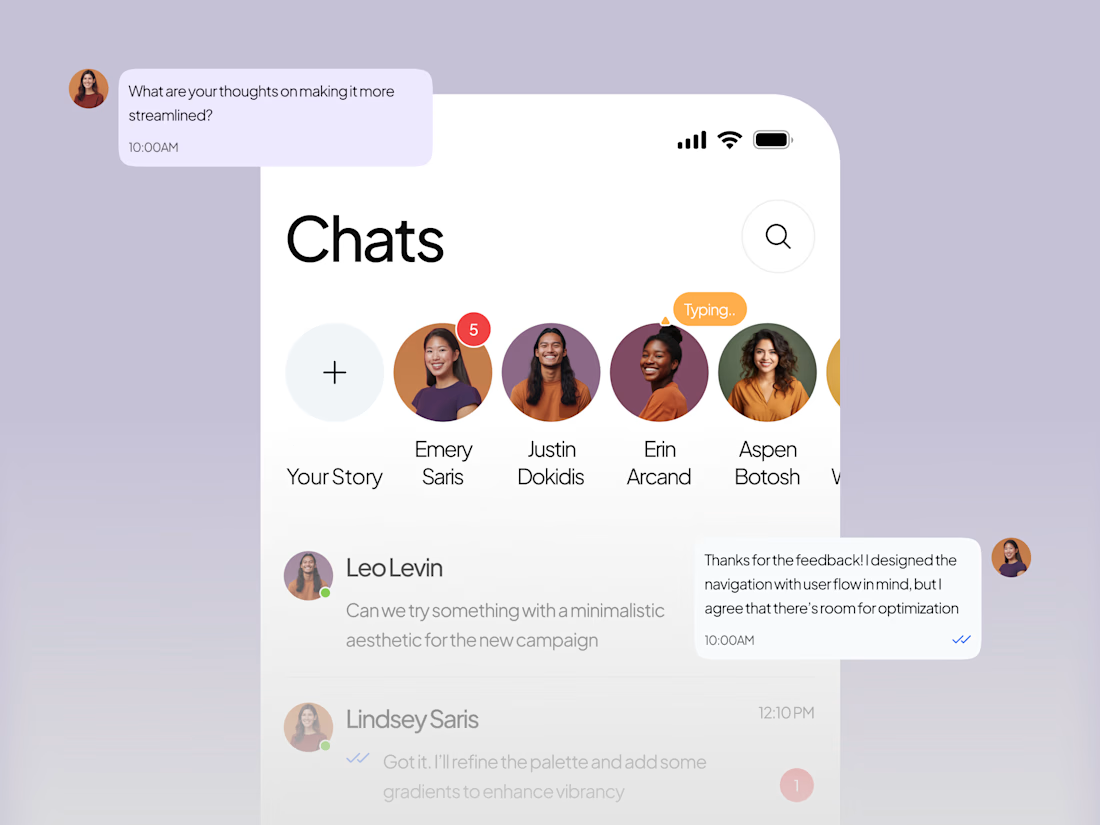
Designed a user-friendly messaging app for fast-moving creative teams.


Clean execution

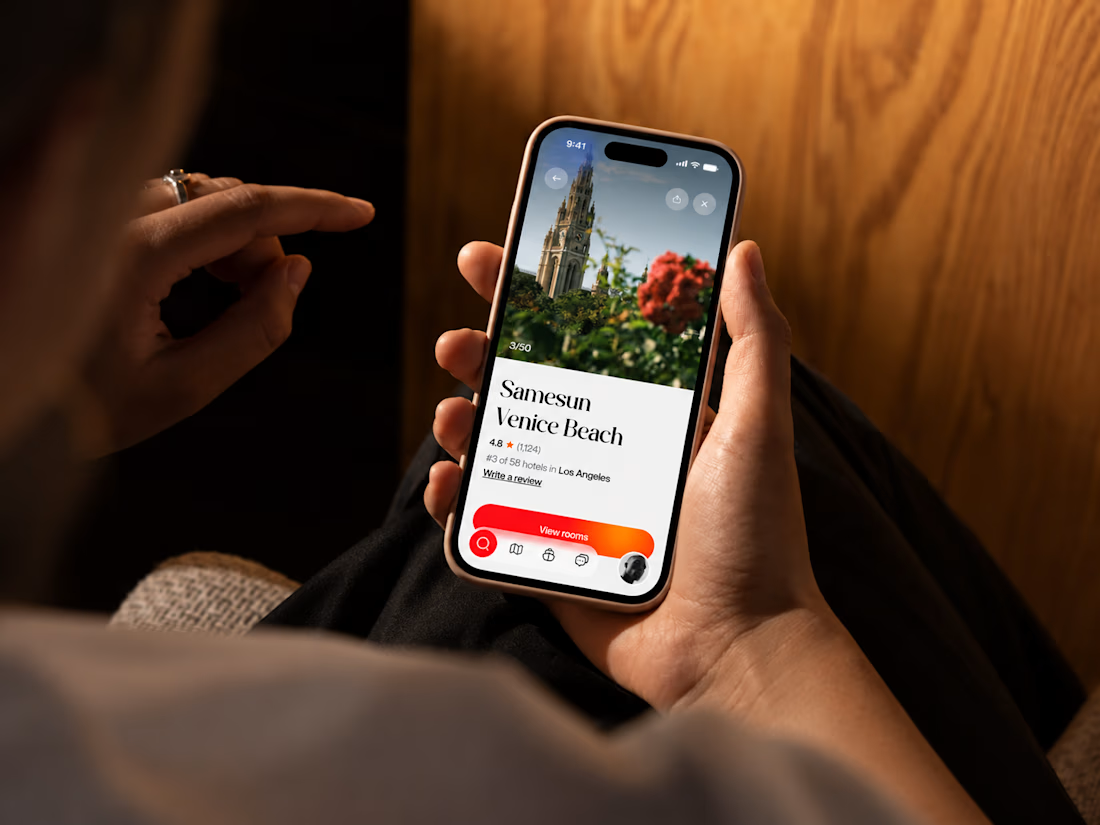
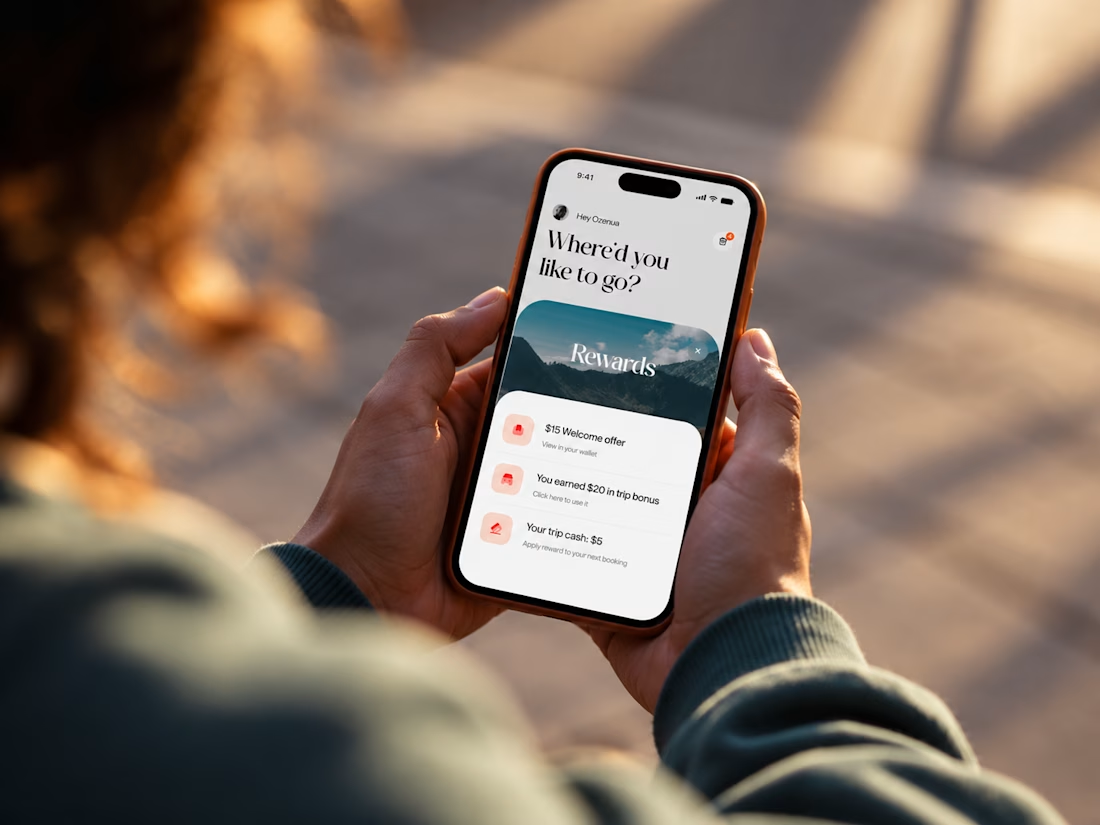
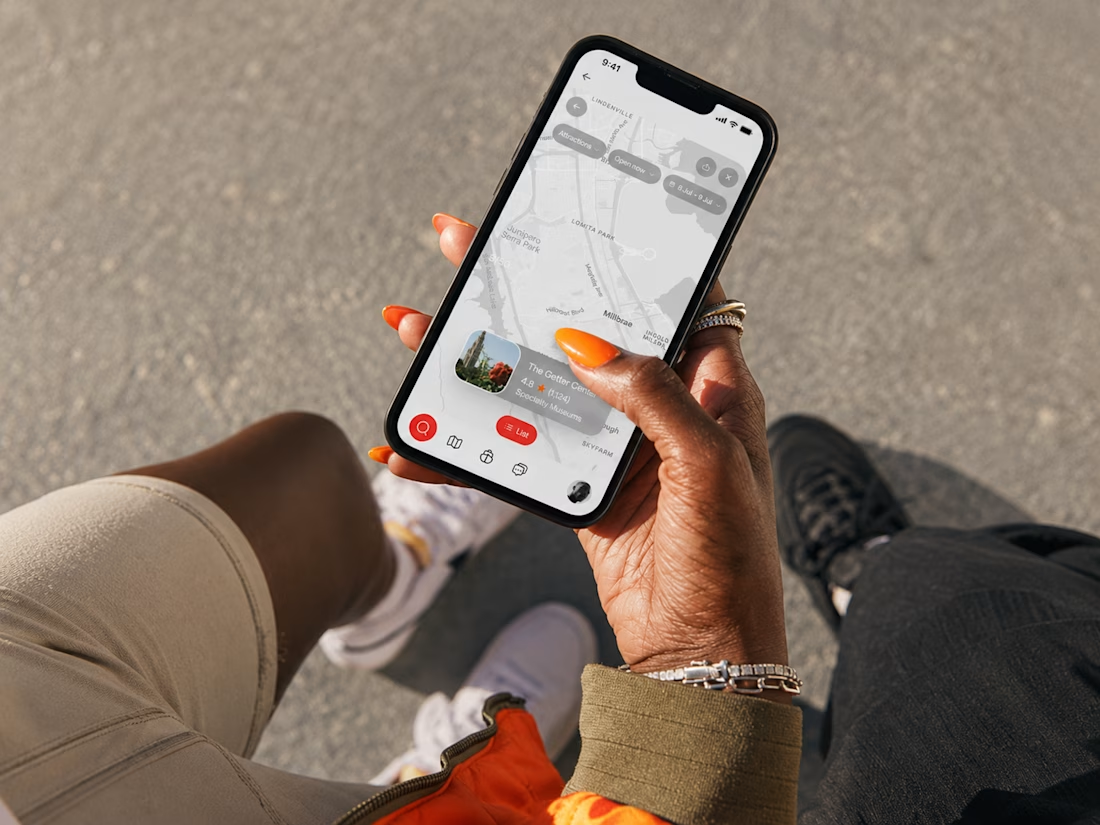
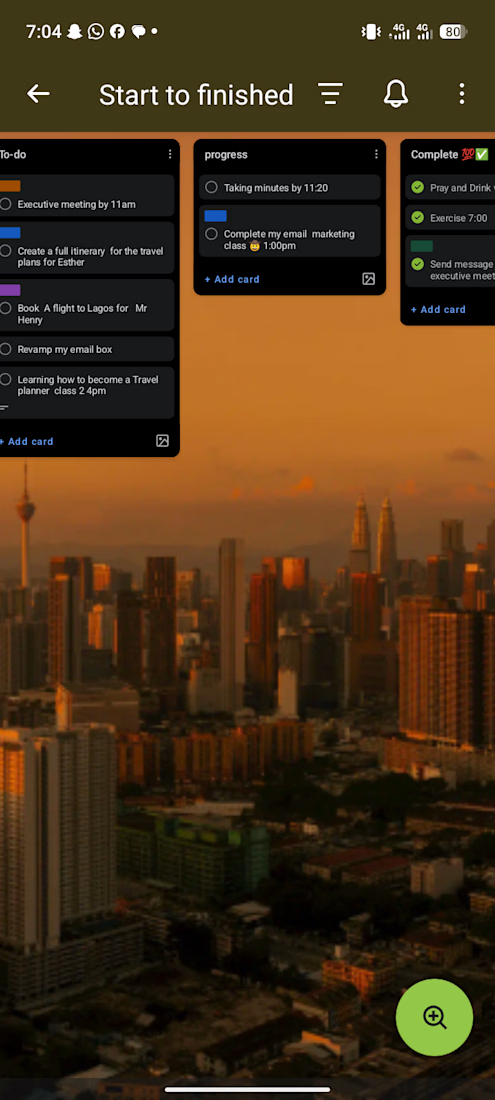
Recent project for a Travel Planner app
I am available for work on projects like this one