The network for creativity
Join 1.25M professional creatives like you
Connect with clients, get discovered, and run your business 100% commission-free
Creatives on Contra have earned over $150M and we are just getting started
Back to feedPost
Coffee Shop Performance Dashboard
Created an interactive business intelligence dashboard in Excel to analyze coffee shop operations. Tracked over 149K orders to uncover key insights, including peak sales hours, top revenue-generating items, and location-wise sales metrics.
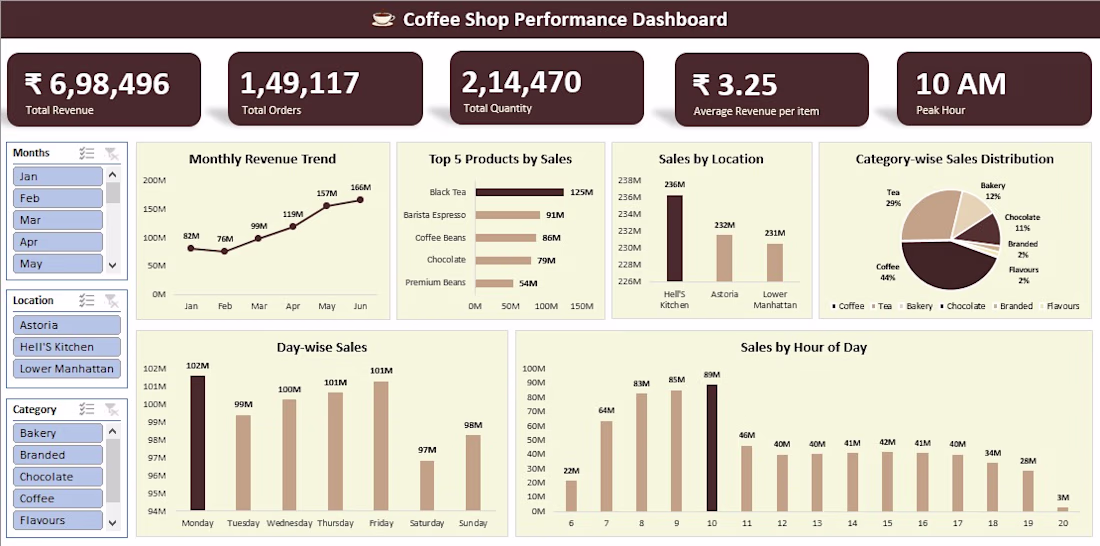
149K orders analyzed and the peak hour insight at 10 AM is so actionable — that's exactly the kind of detail that helps a business owner make real decisions. The color theme matching the coffee brand is a nice touch too!
Thank you so much, Geethasree! Glad you liked the coffee-themed design and found the peak hour insights valuable. 😊
The network for creativity
Join 1.25M professional creatives like you
Connect with clients, get discovered, and run your business 100% commission-free
Creatives on Contra have earned over $150M and we are just getting started
Related posts
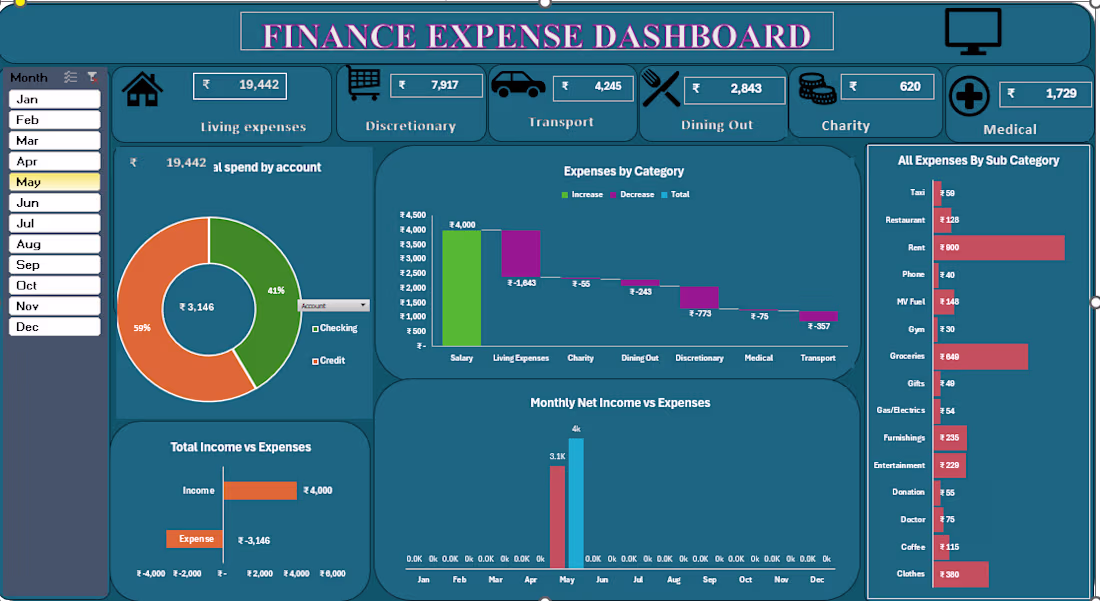
Built a finance expense dashboard using Excel to track income, expenses, and category-wise spending in a simple, visual way.
Turned raw data into clear insights like savings trends, spending patterns, and monthly breakdowns.
Always improving my Excel and data visualisation skills through real projects.
Project Launch: Premium AI SaaS Dashboard Starter Kit 🚀
I’ve spent the last few days building a production-ready dashboard designed for anyone looking to launch an AI product with a "Hollywood-grade" aesthetic.
The Tech Stack:
⚛️ Next.js 15 (App Router) & React 19
🎨 Tailwind CSS 4.0 for ultra-fast styling
🌐 Three.js (React Three Fiber) for the interactive liquid visualizer
🛠️ Dynamic Theme Engine — Switch brand accents (Cyan, Violet, Emerald, Amber) globally with one click.
Most dashboard templates look the same. I wanted to build something that feels alive, responsive, and easy for developers to customize and scale.
Check it out on my Products page! 👇
#NextJS #WebDevelopment #AI #SaaS #ThreeJS #DesignSystem
Bro casually said ‘dashboard starter kit’ and dropped a whole cinematic AI product interface instead 😭🚀
This is not a template… this is a flex.
Honestly, I feel my day would improve if this little guy lived on my phone dashboard.
How can you be sad with this little one keeping you company? lol
Trending
Claude
Claude has entered the design space. How are you using Claude Design?
Contra University
Learn from expert creatives how to earn more using next-gen AI tools.
creativeaiflow
Creative AI workflows are evolving. What tools do you use, and what are their strengths and weaknesses?
portfolioreview
The best portfolios tell a story, not just show a grid. Share yours for feedback.
freelancerlife
Freelancer life is wins, pivots, and everything in between. What’s yours right now?