
Aniket More
Data Science/Analysis, Excel, Python, Power Bi, Scikit learn
Ready for work
Aniket is ready for their next project!
Hello All, Below is a sample Dashboard for a sales data prepared using excel. It uses data visualizations in excel and interactive slicers to modify the visuals.
0
42
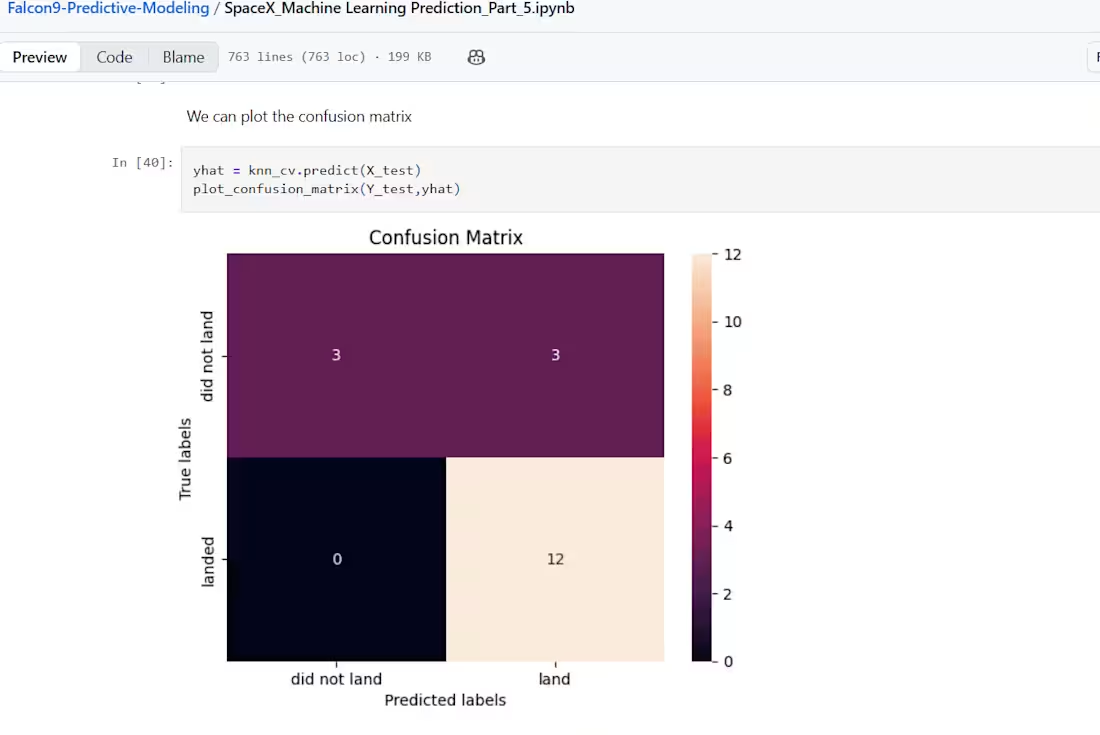
Here is the Capstone project I have got hands on experience on while completing professional certification course. It web Scrapes data from web for falcon rockets and builds a predictive model using machine learning algorithm using scikit learn model
1
59
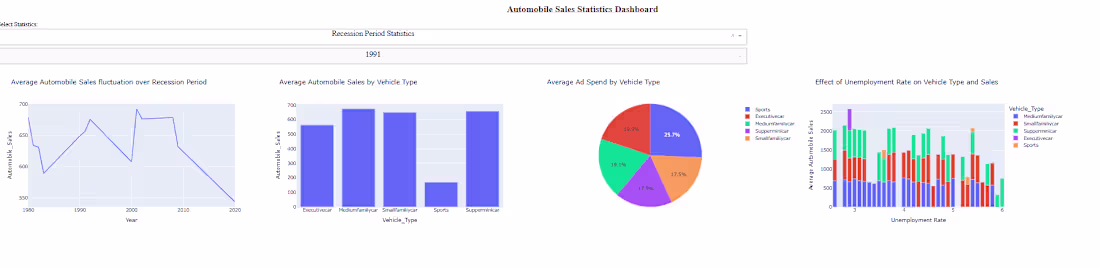
Below is an interactive web based dashboard, using Python pandas, plotly dash. The graphs are interactive and gets updated automatically using the drop down provided.
1
80
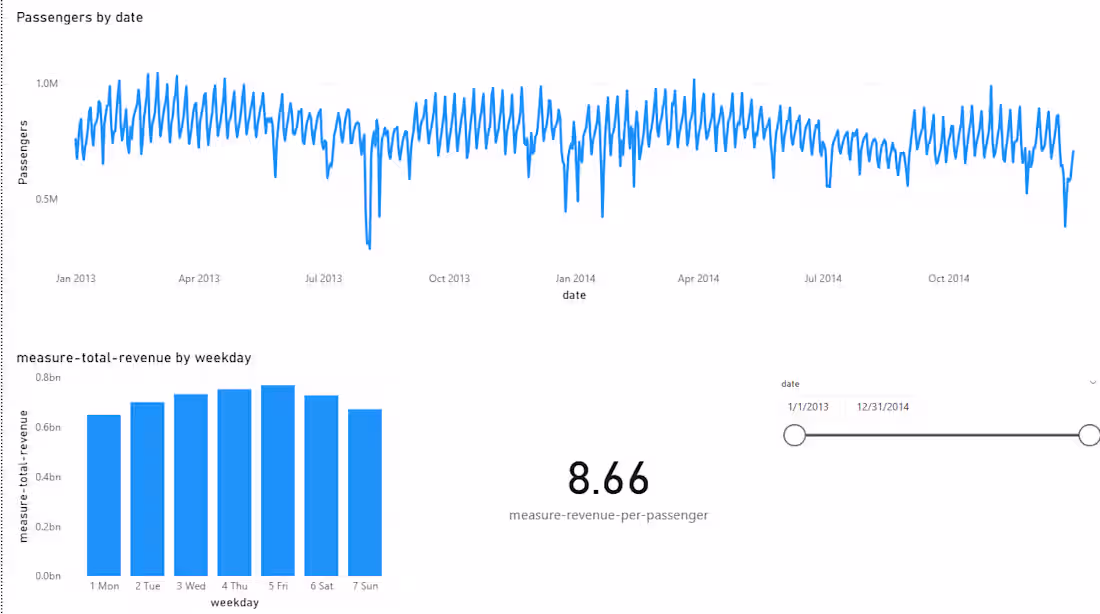
This is a practice project I worked on to exclusive on power bi to make a simple dashboard to have an interactive visual, with date sliders. With metrics like revenue per passengers, and passenger by date
1
65