Aniket More
Data Science/Analysis, Excel, Python, Power Bi, Scikit learn
Ready for work
Aniket is ready for their next project!
Hello All, Below is a sample Dashboard for a sales data prepared using excel. It uses data visualizations in excel and interactive slicers to modify the visuals.
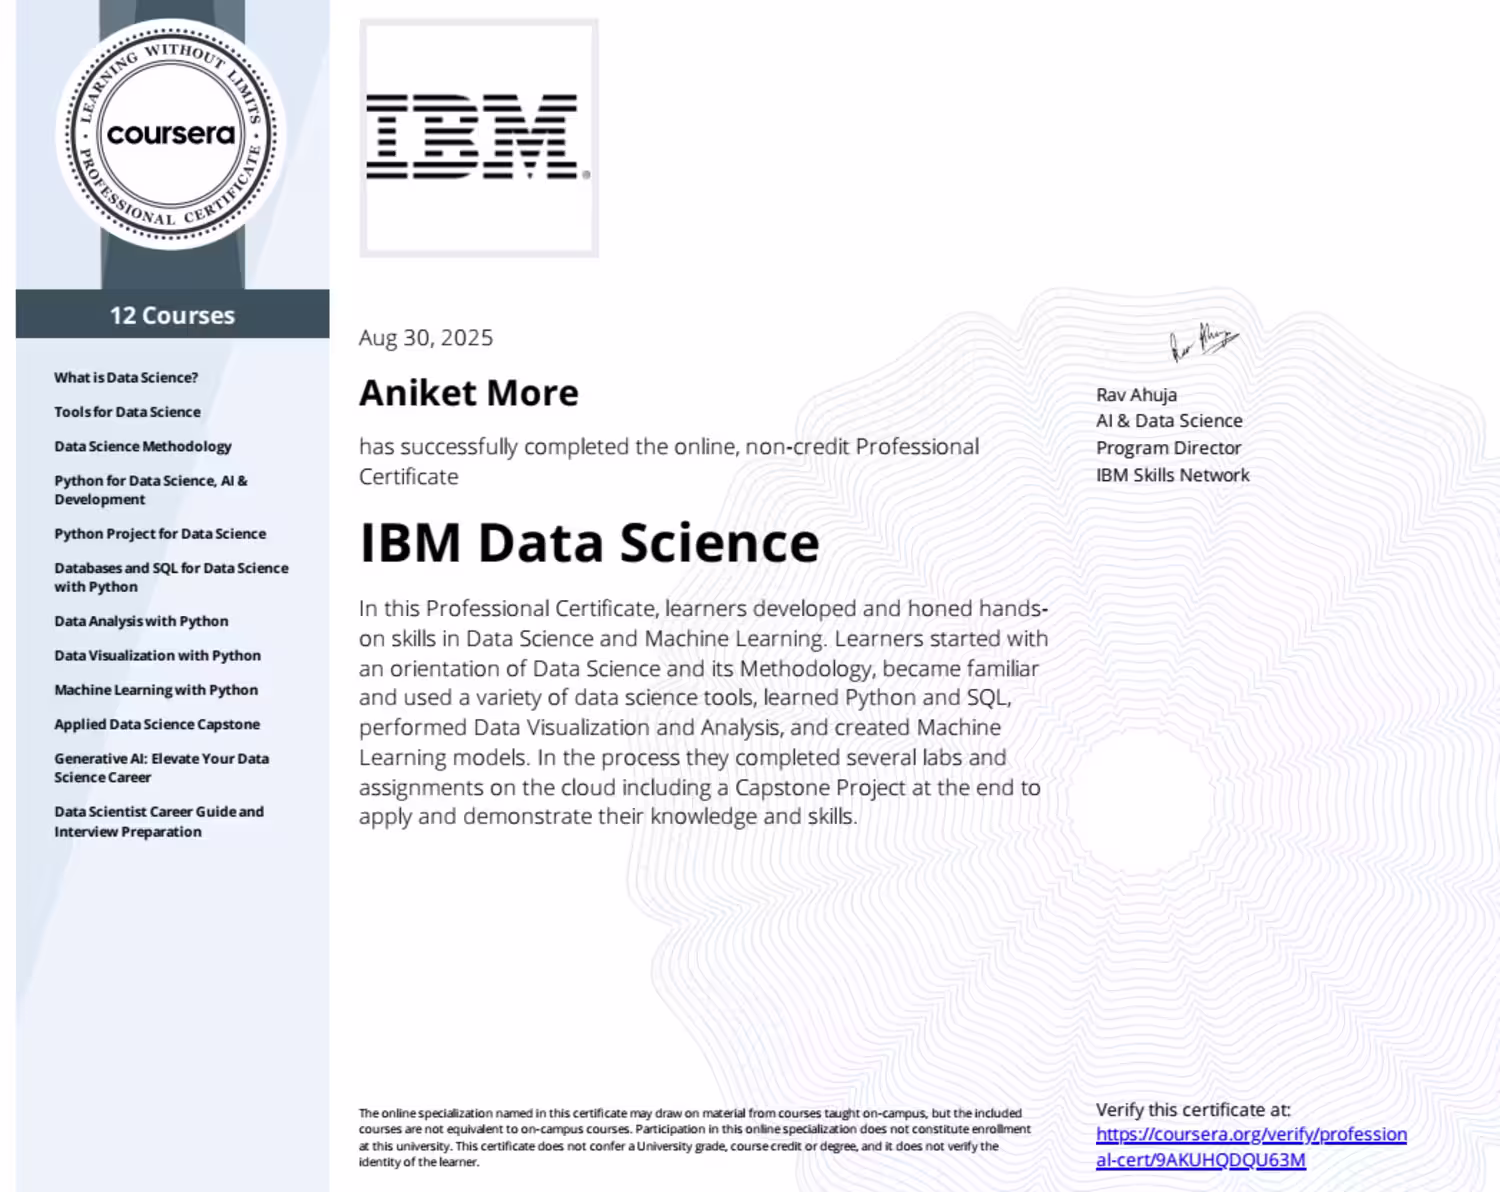
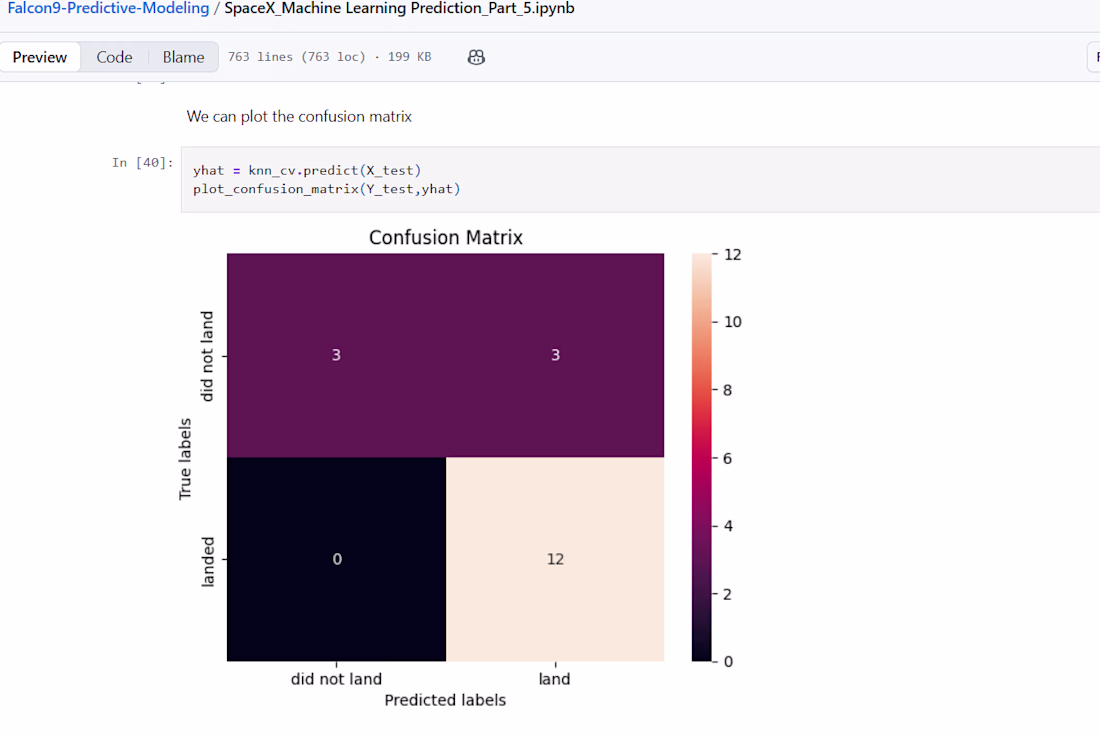
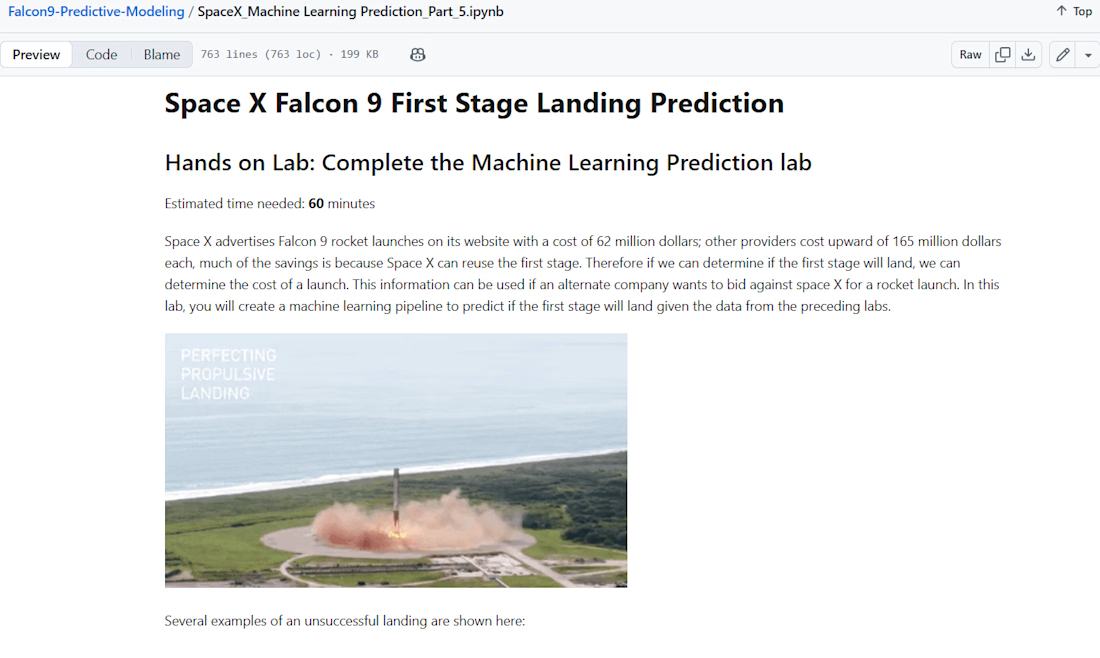
Here is the Capstone project I have got hands on experience on while completing professional certification course. It web Scrapes data from web for falcon rockets and builds a predictive model using machine learning algorithm using scikit learn model

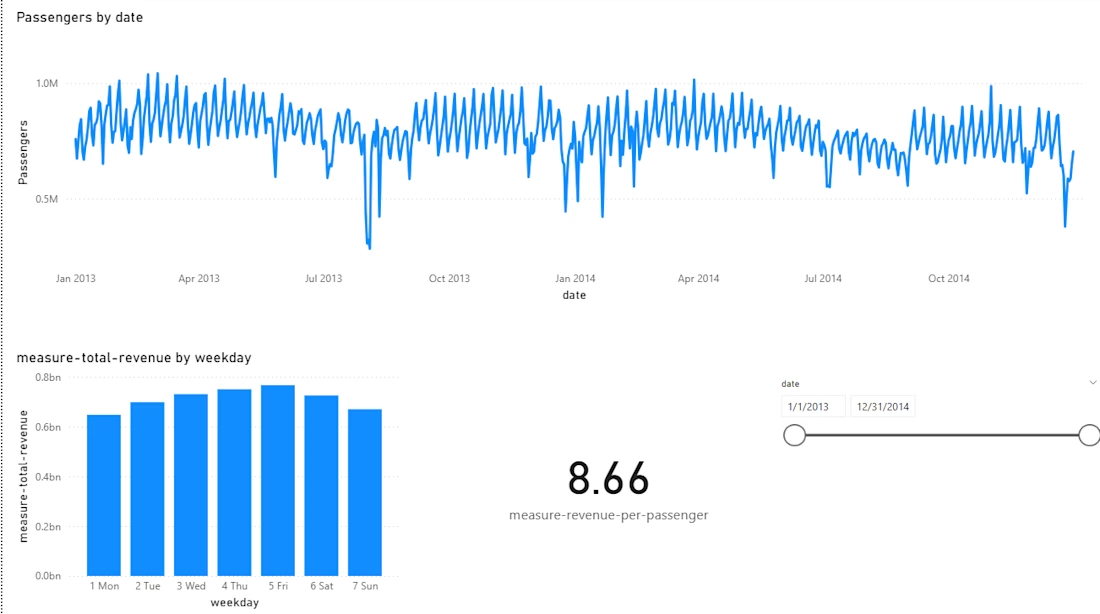
This is a practice project I worked on to exclusive on power bi to make a simple dashboard to have an interactive visual, with date sliders. With metrics like revenue per passengers, and passenger by date
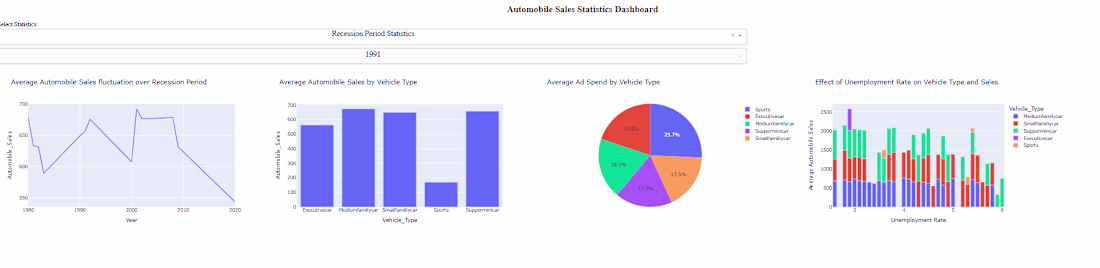
Below is an interactive web based dashboard, using Python pandas, plotly dash. The graphs are interactive and gets updated automatically using the drop down provided.