
Samuel Maina

Data Analyst | SQL, Python, Excel, and Power BI Expert.
- 4
- Followers


Retail Fraud Analysis
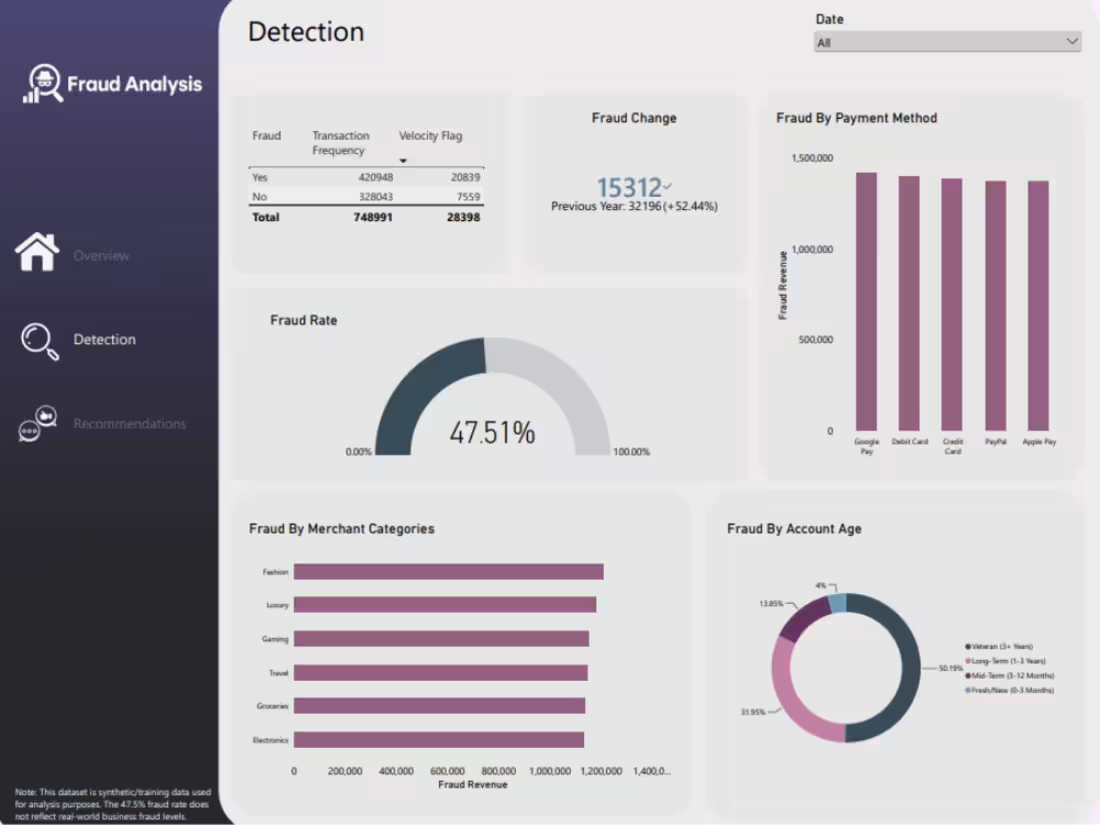
Retail businesses face a tough balancing act: missing real fraud drains revenue, while excessive security flags can disrupt legitimate customers.
I built an end-to-end fraud analytics project using 100,000 retail transactions to uncover fraud patterns and risk exposure across payment methods, merchant categories, account age, transaction behavior, and locations.
The Data Challenge & Solution
Data profiling revealed that the native fraud-risk score was broken, flatlined at 0.0 across all records, while two location-related fields contained duplicate information. Instead of fabricating a risk score, I engineered a transparent Risk Level classification (Low, Medium, High) using behavioral security indicators including velocity, proxy/VPN usage, and high-risk devices.
Technical Execution
SQL: Cleaned data, removed duplicates, standardized formatting, and handled null values.
Power BI: Built an interactive 3-page dashboard: Overview, Detection, and Recommendations.
Key Findings
Medium Risk transactions carried the highest financial exposure at approximately $7.1M, followed by High Risk at $3.3M.
Fraud was concentrated in lower transaction-value brackets ($0–$500).
Domestic transactions accounted for 66.8% of activity, versus 33.2% international.
Analysis covered payment methods, merchant categories, account age, transaction frequency, velocity indicators, and countries.
1
70
Retail Inventory and Sales Analysis
Retailers often collect large amounts of sales and inventory data but struggle to turn it into clear decisions around stock, demand, and revenue performance.
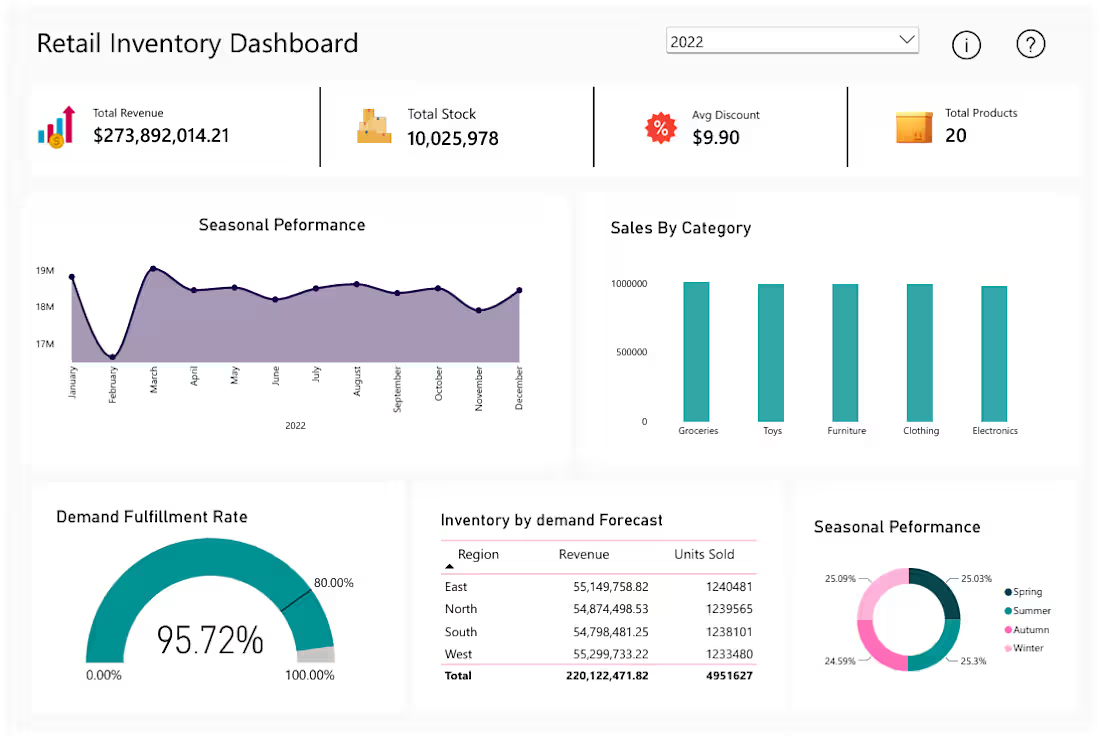
I built an end-to-end retail analytics solution using Python, MySQL, and Power BI. With Python and Pandas, I cleaned and prepared the raw dataset, handling missing values based on their business meaning rather than blindly replacing them. The data was then analyzed in MySQL to explore revenue, units sold, inventory, discounts, categories, regions, and seasonal performance.
The final result was an interactive Power BI dashboard designed for quick business monitoring. It includes KPI cards for revenue, total stock, demand fulfillment, total products, and average discount, alongside sales by category, monthly seasonal performance, regional revenue and units sold, inventory by demand forecast, and seasonal distribution.
Key findings included a 95.72% demand fulfillment rate, balanced sales across the five product categories, and a near-even distribution of performance across the four seasons. The dashboard also provides a clear view of regional sales and inventory relationships, helping identify where demand and stock performance may require further attention.
1
93
Security Support Information System
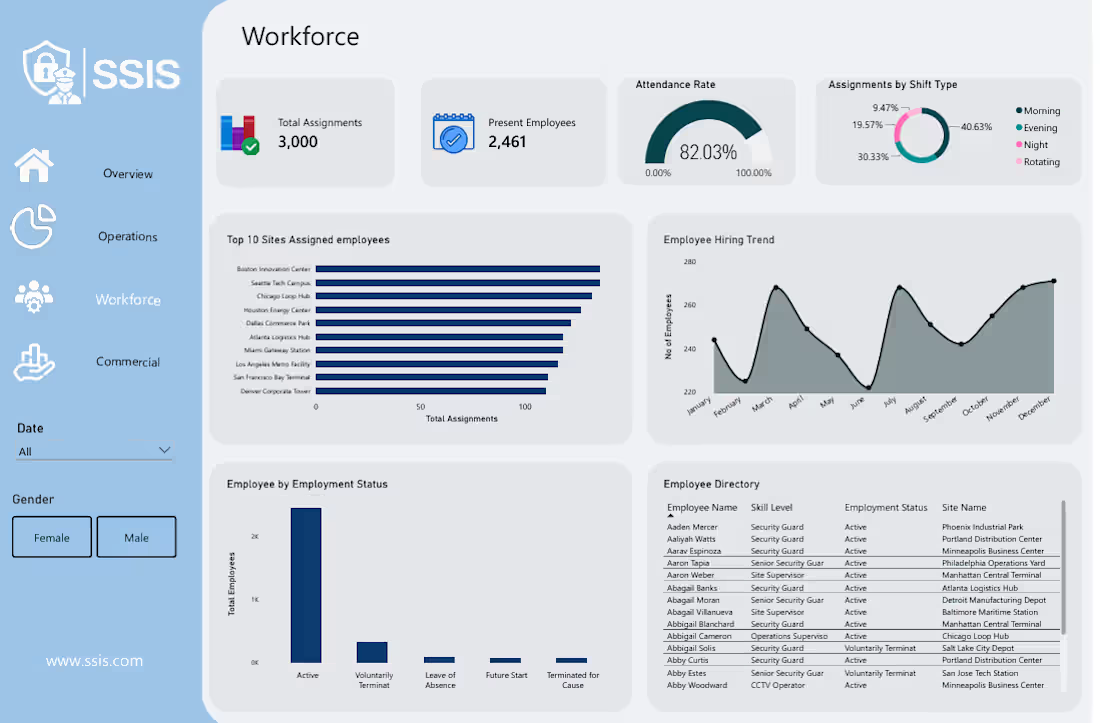
Developed an end-to-end Business Intelligence solution for the private security industry to improve operational visibility and decision-making. The project involved data cleaning and transformation using Python, relational database design in MySQL, SQL data management, and interactive dashboard development in Microsoft Power BI. The final solution consists of four dashboards covering Executive Overview, Workforce Analytics, Operations Analytics, and Commercial Analytics
1
76