
Amna Soomro
Data Analyst - Tableau & Power BI Dashboard Specialist
New to Contra
Amna is ready for their next project!
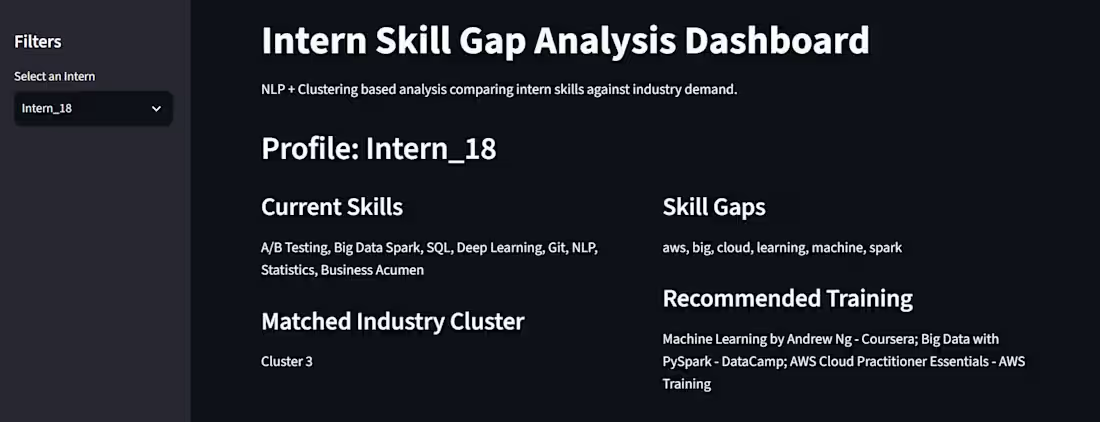
Skill Gap Analysis Tool (ML)
Problem: Recruiters and training teams often struggle to pinpoint exactly which skills a candidate or intern is missing versus what a role requires.
What I built: A skill gap analysis model comparing candidate profiles against role requirements.
Result: Turns vague "needs improvement" feedback into a specific, actionable skill gap breakdown.
Tags: Machine Learning, Recruitment Analytics, Python, Talent Development
0
22
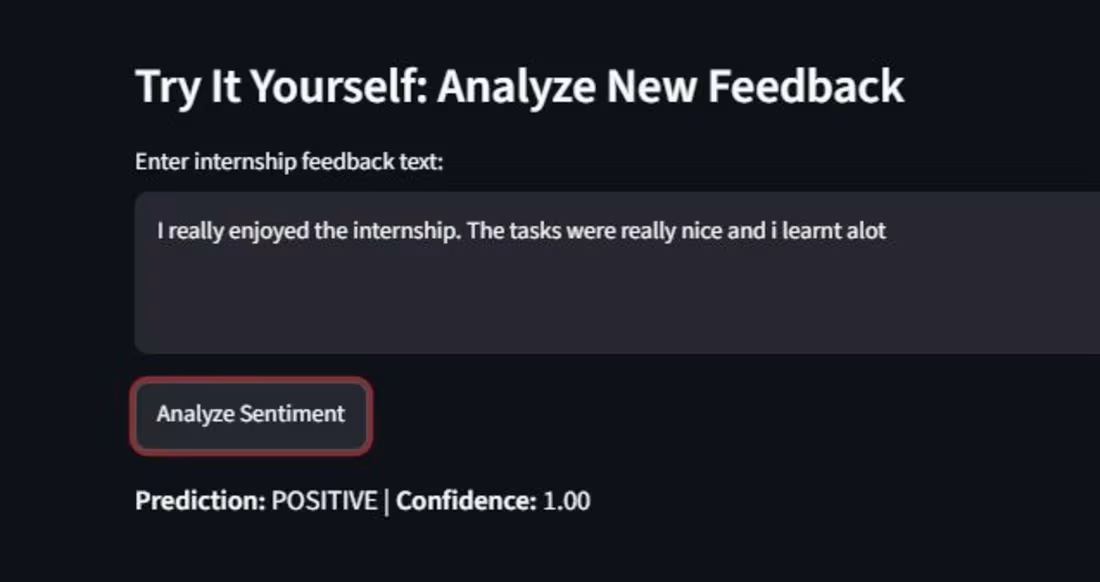
Sentiment Analysis for Intern Feedback (ML)
Problem: Companies collect intern/employee feedback but rarely analyze it systematically to catch dissatisfaction early.
What I built: A machine learning sentiment analysis model to classify feedback and flag negative sentiment patterns.
Result: Enables HR teams to catch morale or engagement issues before they escalate.
Tags: Machine Learning, NLP, HR Analytics, Python
0
28
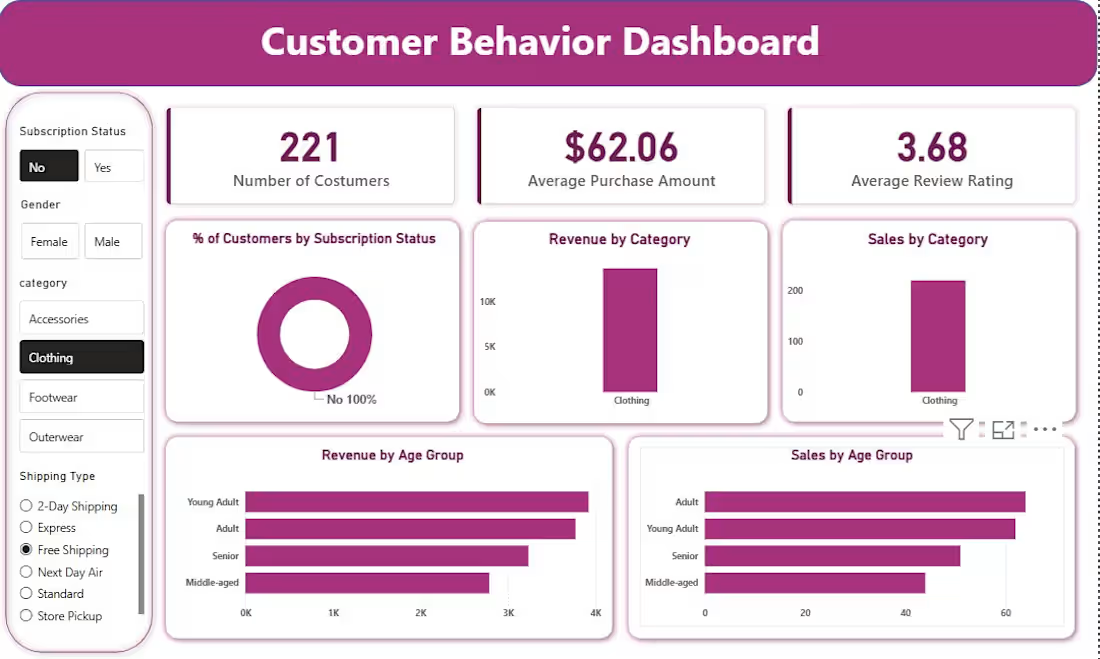
Customer Behavior Dashboard (Power BI)
Problem: 3,900 raw customer transactions needed to be turned into a full analytics project, not just a chart.
What I built: Cleaned and engineered features in Python, wrote business-focused SQL queries in PostgreSQL, then built an interactive Power BI dashboard covering subscription status, revenue and sales by category, and revenue/sales by age group.
Result: Surfaced insights like male customers driving nearly double the revenue of female customers, a clear loyalty gap among repeat non-subscribers, and pricing issues on discount-dependent products.
Tags: Python, SQL, Power BI, Customer Analytics, Business Intelligence
0
26
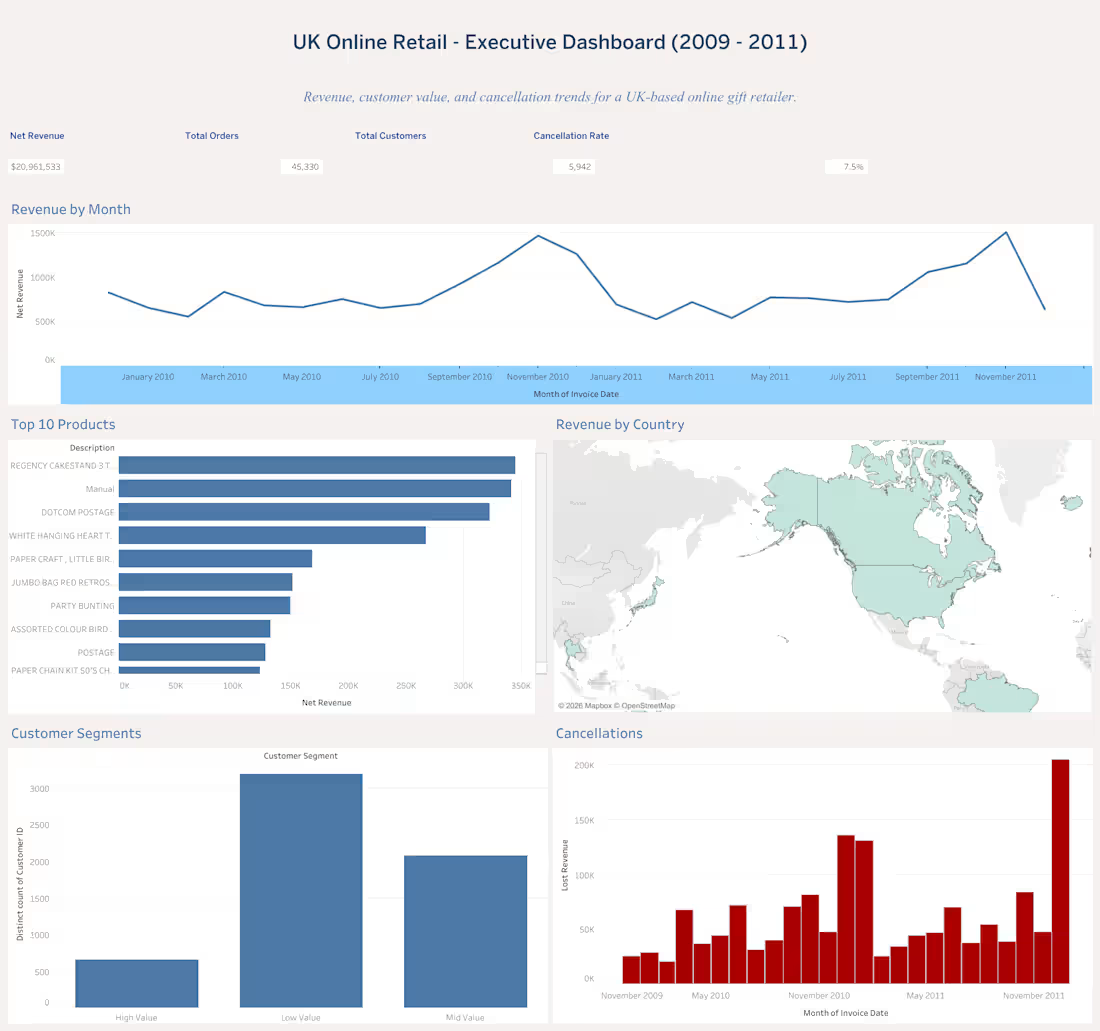
E-commerce Executive Dashboard (Tableau)
Problem: A UK online retailer's sales data was scattered across transactions with no clear view of revenue trends, top products, or customer value.
What I built: An executive dashboard in Tableau covering revenue trends, top-performing products, country-level sales via map view, customer value segments, and cancellation patterns.
Result: Gave stakeholders a single view to spot revenue leaks and high-value customer segments at a glance.
0
28