
AKLILU ABRHAM ROBA
Advanced Statistical Analysis & Research Expert
Ready for work
AKLILU ABRHAM is ready for their next project!
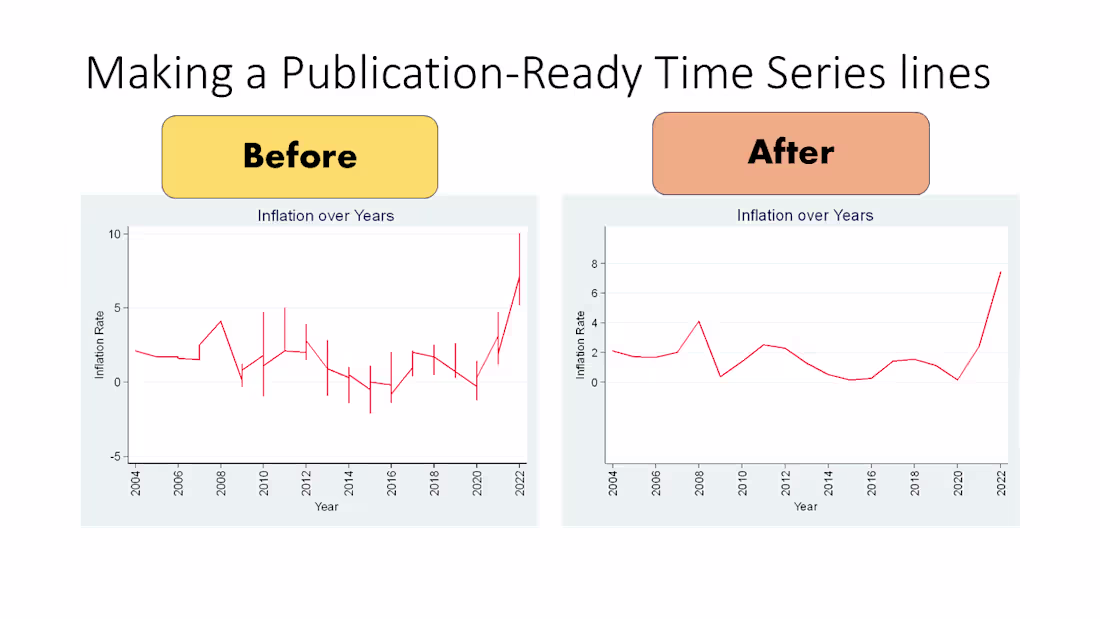
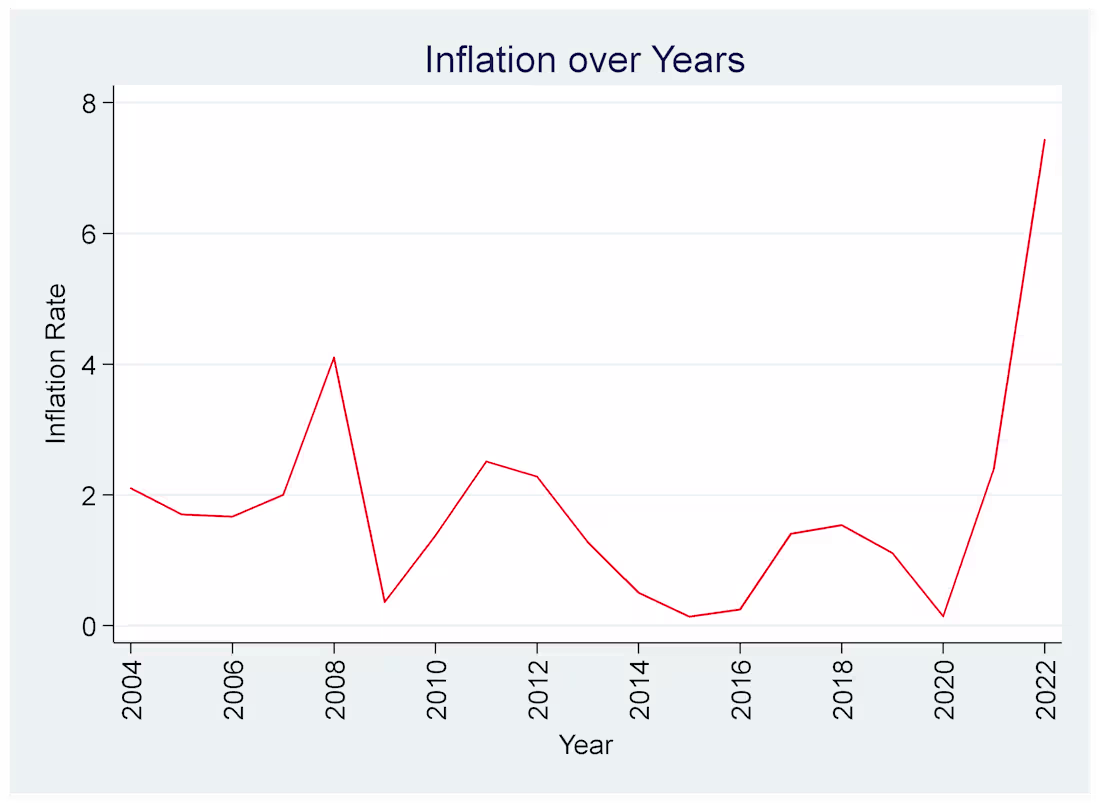
Turning messy time-series plots into publication-ready figures.
Before: cluttered line and distracting spikes that hide the story.
After: cleaned, consistent formatting, and a smoother trend line that makes the pattern readable.
If you have a dataset that needs a journal-ready figure (and export at high resolution), message me.
0
22
Precision Matters.
Bad data leads to bad conclusions. I specialize in high-level statistical analysis and rigorous research methodology (APA 7 expert). From cleaning messy datasets to producing Q1-journal-ready tables, I handle the heavy lifting so you can focus on the breakthrough.
Ready to elevate your research in 2026? Let's connect.
Tags: #AcademicResearch #Statistics #SPSS #Stata #DataScience
0
22
Data doesn't take a holiday, and neither does accuracy. ❄️📈
Celebrating the #HolidayChallenge by showcasing what I do best: Professional Data Analysis & Statistical Consulting. From Healthcare to Finance, I help you make sense of the numbers. Let’s collaborate!
1
66
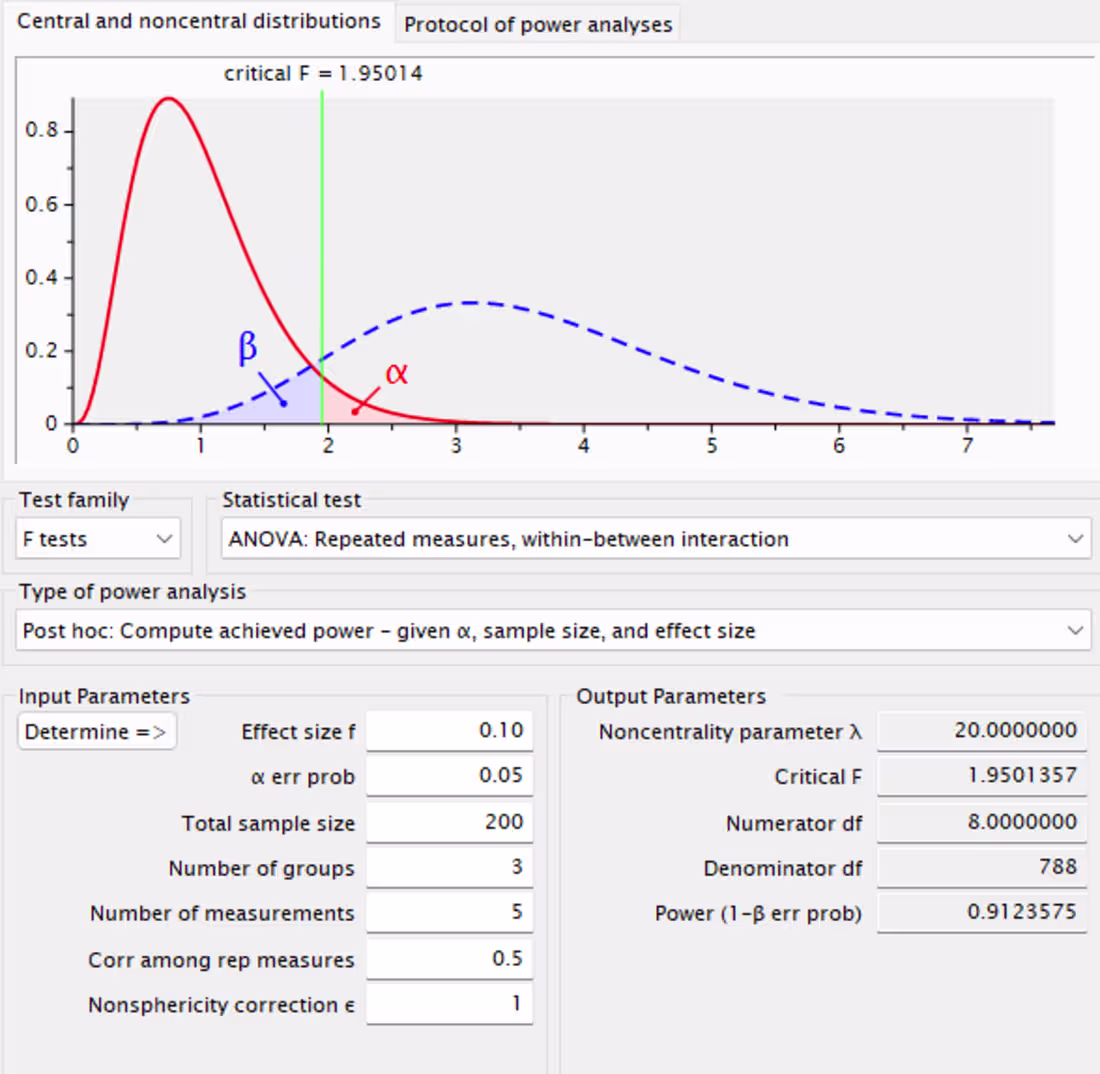
Project: Statistical Design & Power Analysis for IPV Intervention Study
I delivered a same-day Data Analysis Plan and Power Analysis for a complex longitudinal study (3 groups, 18-month duration).
Method: Mixed-Design ANOVA (Within-Between) using G*Power.
Outcome: Verified that a sample size of N=200 yields 91.24% Power, ensuring the study is robust enough to detect small effects (f=0.10).
1
70
Project Title: European Corporate Growth Analysis (STATA) 📈
The Work:
A deep-dive analysis of 1,734 data points across Europe (2004–2022). I used Robust Linear Regression to test the impact of Inflation, GDP, and ECB Interest Rates on company growth.
Key Deliverables:
6-Stage Regression Analysis: Moving from baseline controls to complex interaction terms.
Data Cleaning & Testing: Managed issues of heteroskedasticity and multicollinearity to ensure "trustworthy" estimates.
Visual Trend Analytics: Created high-clarity time-series graphs tracking Inflation, Debt, and GDP Growth through three major global economic cycles.
Tools Used: STATA 16, Excel, Econometric Modeling.
1
38

Multilevel Modeling & Complex Survey Data
0
2
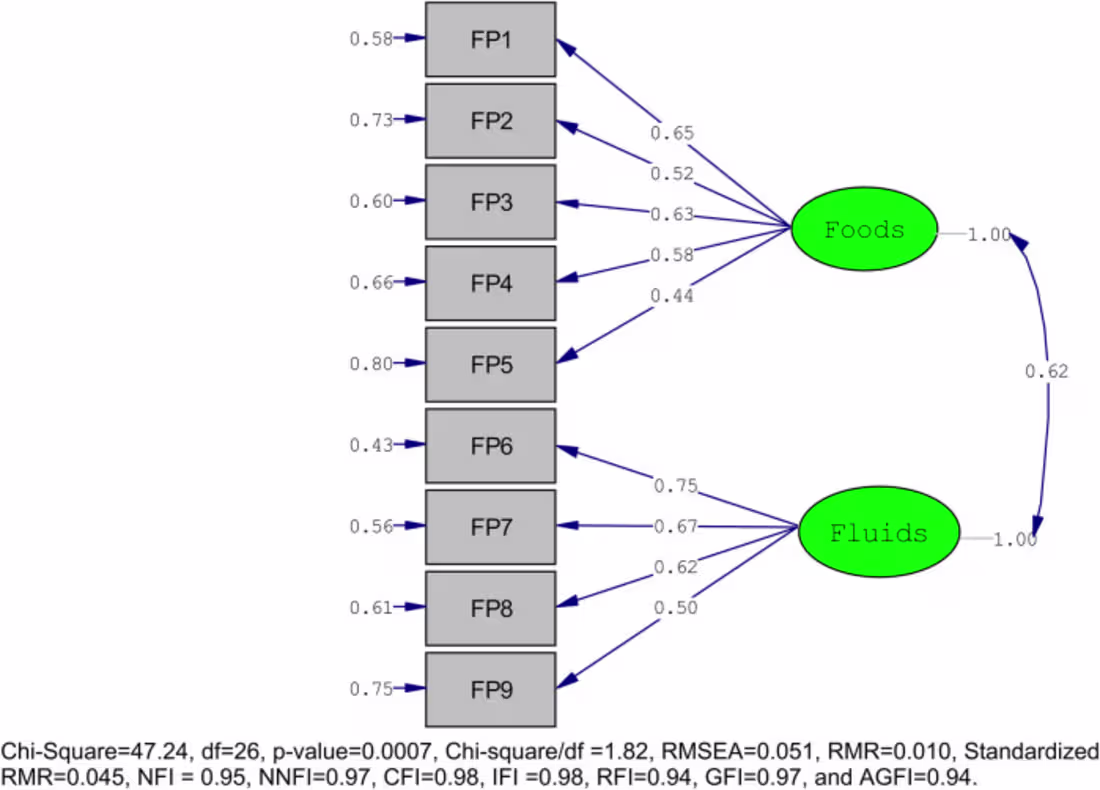
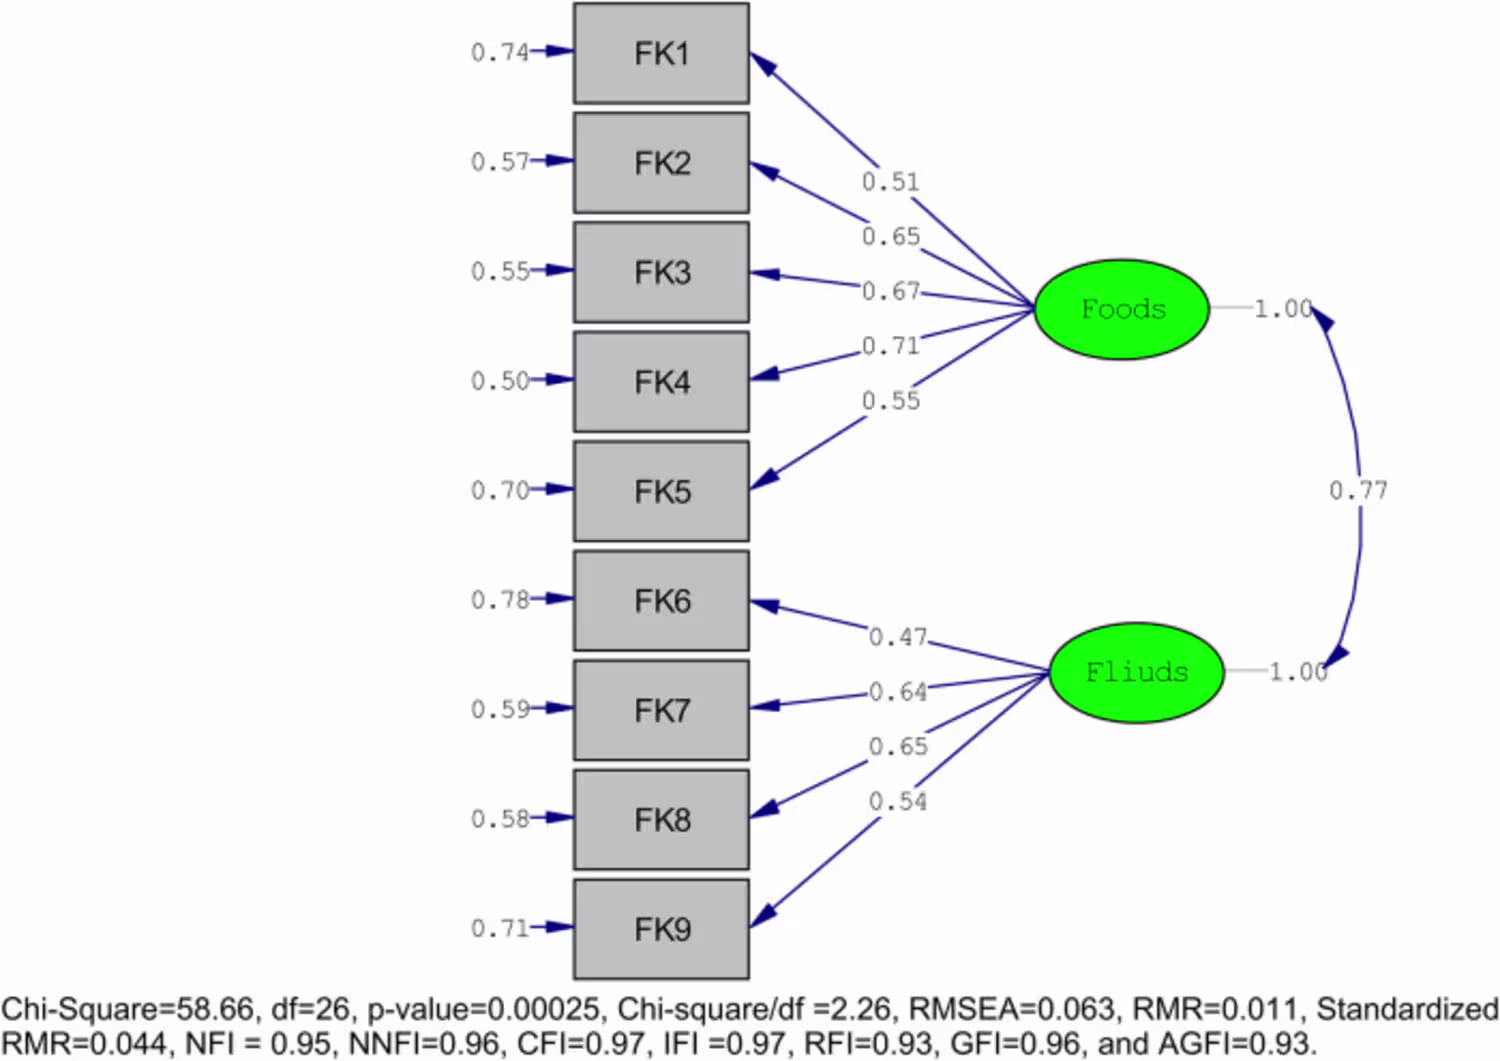
When all your fit indices align perfectly 📊
RMSEA=0.051, CFI=0.98, p<0.001 ✅
This is publication-ready statistical analysis—rigorous, reproducible, and meeting top journal standards.
Need help with SEM, CFA, or advanced quantitative methods? DM me.
0
21