
Adeel Khan
Entry-level Data & SEO professional with analytics skills
Ready for work
Adeel is ready for their next project!

planorastudioo.gumroad.com
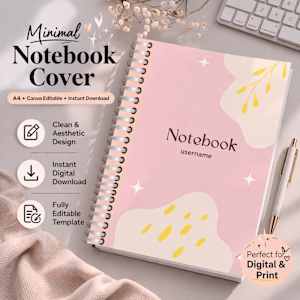
Minimalist Abstract Notebook Cover (A4) – Canva Editable Template | Printable Style Digital Download
This minimal abstract A4 notebook cover is designed to give your notes, journals, or digital planners a polished and stylish look — without any complexity.The ProblemMost notebook covers are: Too cluttered or overly designed Hard to customize Not suitable for both digital & print use The SolutionThis template gives you a simple, elegant, and fully editable notebook cover that you can personalize in minutes using Canva.No design skills needed.Who Is This For? Students who want organized, aesthetic notes Freelancers & professionals Digital planner users (iPad / tablet) Anyone who loves clean, minimal design Benefits (What You Get)✔ Create a professional-looking notebook instantly✔ Save time — no need to design from scratch✔ Fully customizable (name, title, colors)✔ Works for both digital use & printing✔ Clean design that improves focusWhat You’ll Receive A4 Notebook Cover Template Canva Editable File (easy to customize) Instant Digital Download How It Works Purchase the product Get instant access link Open in Canva Edit text (name, title, etc.) Download & use digitally or print Important This is a digital product only No physical item will be shipped Personal use only Why This Product?Simple sells.If you want a clean, distraction-free notebook cover that actually looks good and saves your time this is for you.