Advik Rathee's Work | ContraWork by Advik Rathee
Advik Rathee

Advik Rathee

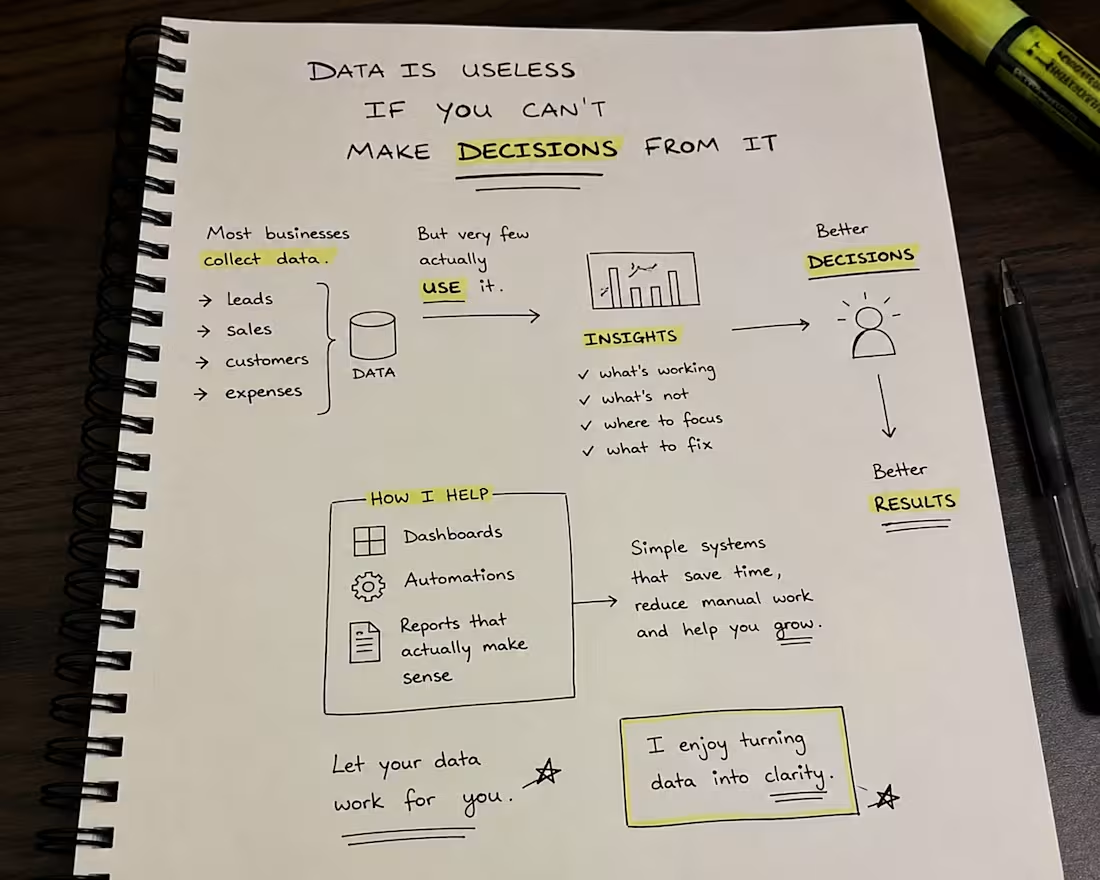
Helping businesses grow with marketing and analytics

New to Contra

Advik is ready for their next project!

Cover image for Built this one for an
Built this one for an e-commerce customer behavior project - 18,000+ customers, segmented using RFM (Recency, Frequency, Monetary) analysis. The interesting part wasn't the segmentation itself, it was what it revealed: nearly 22% of customers were "at risk" of churning, and most businesses wouldn't know that until those customers had already stopped buying. This is the kind of insight that's usually sitting in your order data already, it just needs the right lens. Happy to take a look at your numbers if you're curious what's hiding in yours. Tools used: Power BI, SQL, Python (Pandas, Scikit-learn for clustering)
2
32
Cover image for Executed a Meta Ads campaign
Executed a Meta Ads campaign for a fitness studio, generating 98 qualified leads with a ₹35.56 cost per lead. Optimized audience targeting, creatives, and campaign performance using Facebook and Instagram Ads.
0
13
Cover image for Developed an interactive Financial Stock
Developed an interactive Financial Stock Analysis Dashboard in Power BI using historical stock market data from the Yahoo Finance API. The dashboard compares the performance of AAPL, AMZN, GOOGL, and MSFT through return analysis, volatility metrics, monthly trends, and key performance indicators. Interactive filters and dynamic visualizations help users evaluate stock performance and make data-driven investment decisions.
0
17
Cover image for Designed a Power BI dashboard
Designed a Power BI dashboard to analyze Netflix content using Power Query and DAX. The dashboard highlights key KPIs, genre trends, content distribution, yearly additions, country-wise analysis, and rating insights with interactive visualizations.
0
21
Cover image for Built an interactive E-Commerce Customer
Built an interactive E-Commerce Customer Behavior Dashboard in Power BI to analyze revenue, customer segments, order trends, conversion funnel, and regional performance. Designed to help businesses track KPIs, identify growth opportunities, and make data-driven decisions through clear and actionable visualizations.
0
22