
Advik Rathee
Helping businesses grow with marketing and analytics


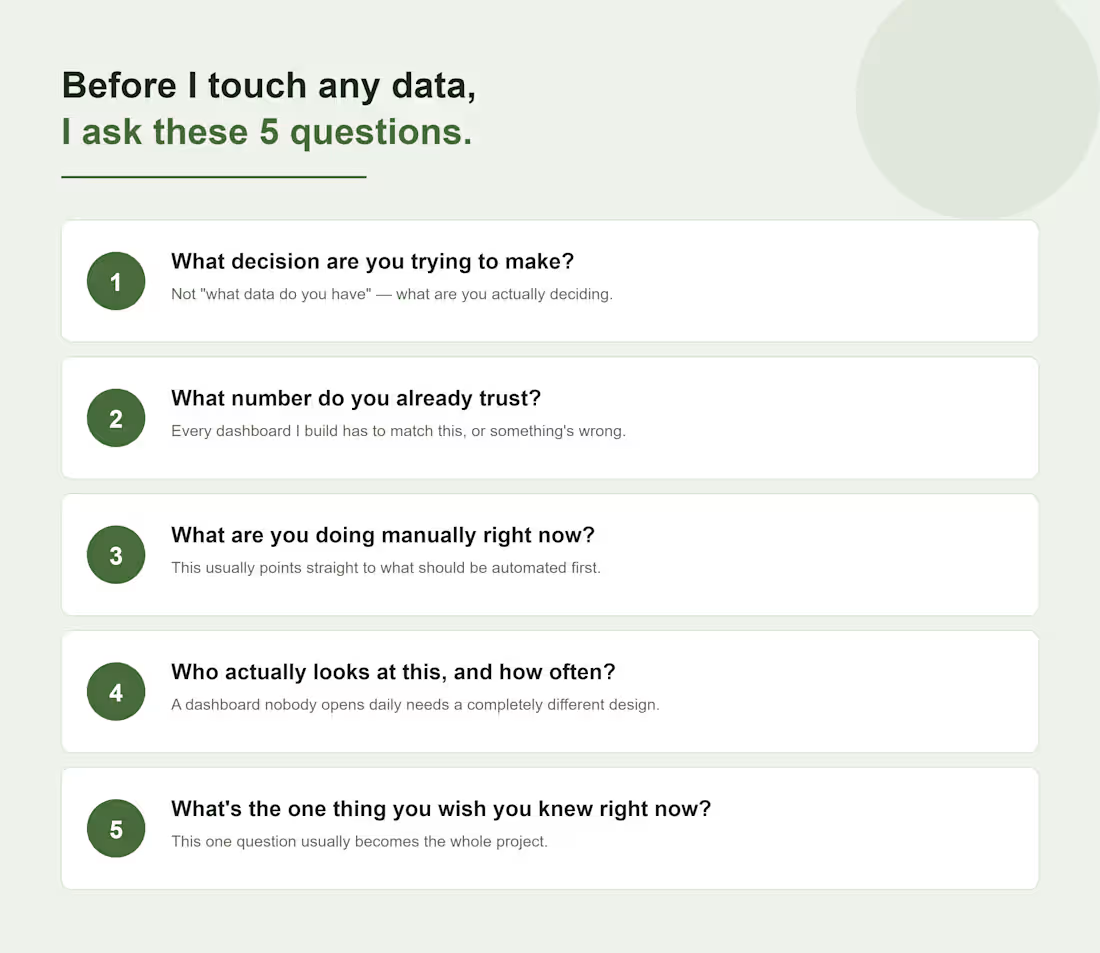
Before I open Power BI or Excel for any project, I ask the business owner these 5 questions first. Sounds basic, but the answers usually tell me more than the data itself does, especially question 5, that one almost always ends up being the actual project.
0
17
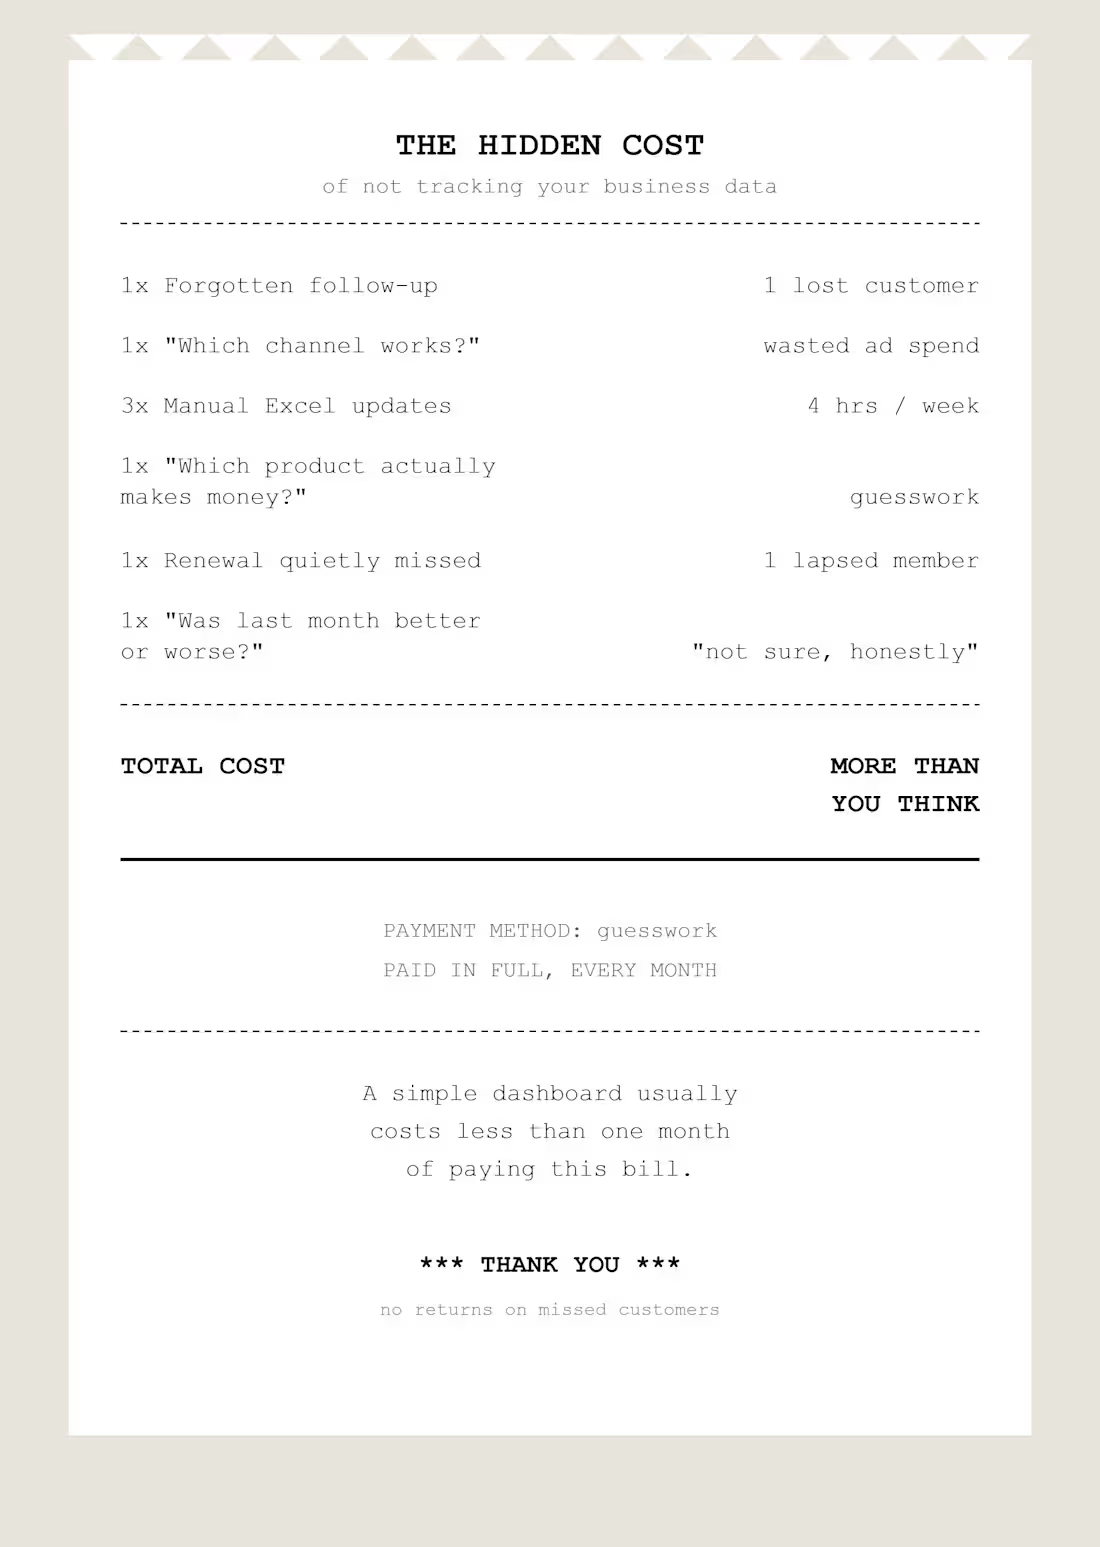
Every business pays this bill. Most just don't realize it's on autopay.
0
25
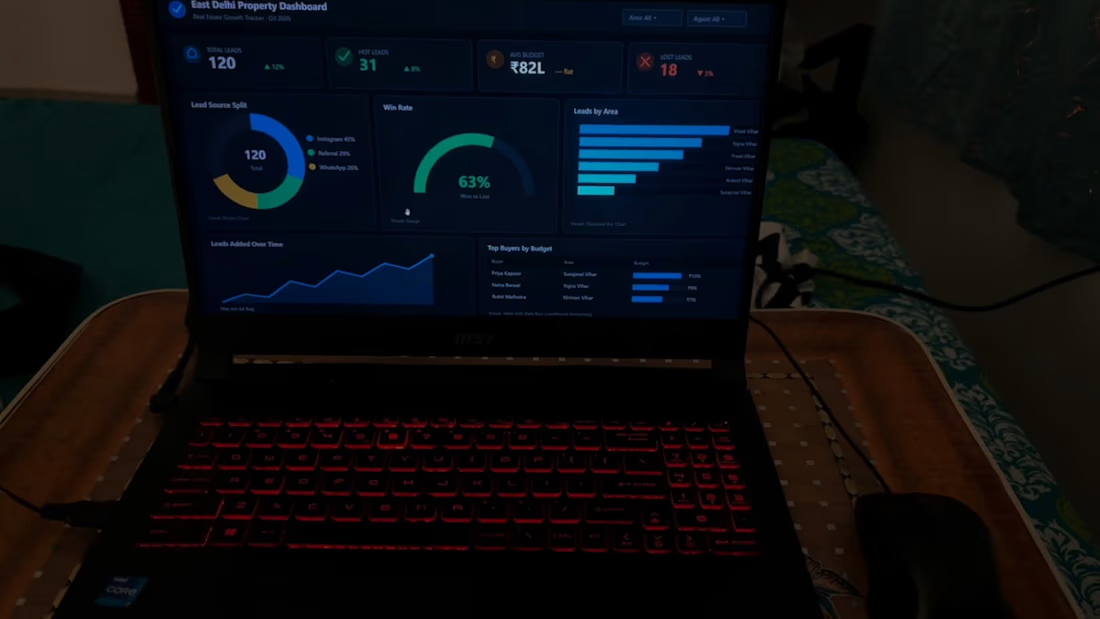
People see the dashboard.
They don't see the hours spent cleaning datasets, validating numbers, rebuilding reports, and starting over when something doesn't add up. That's where the real work happens.
2
129
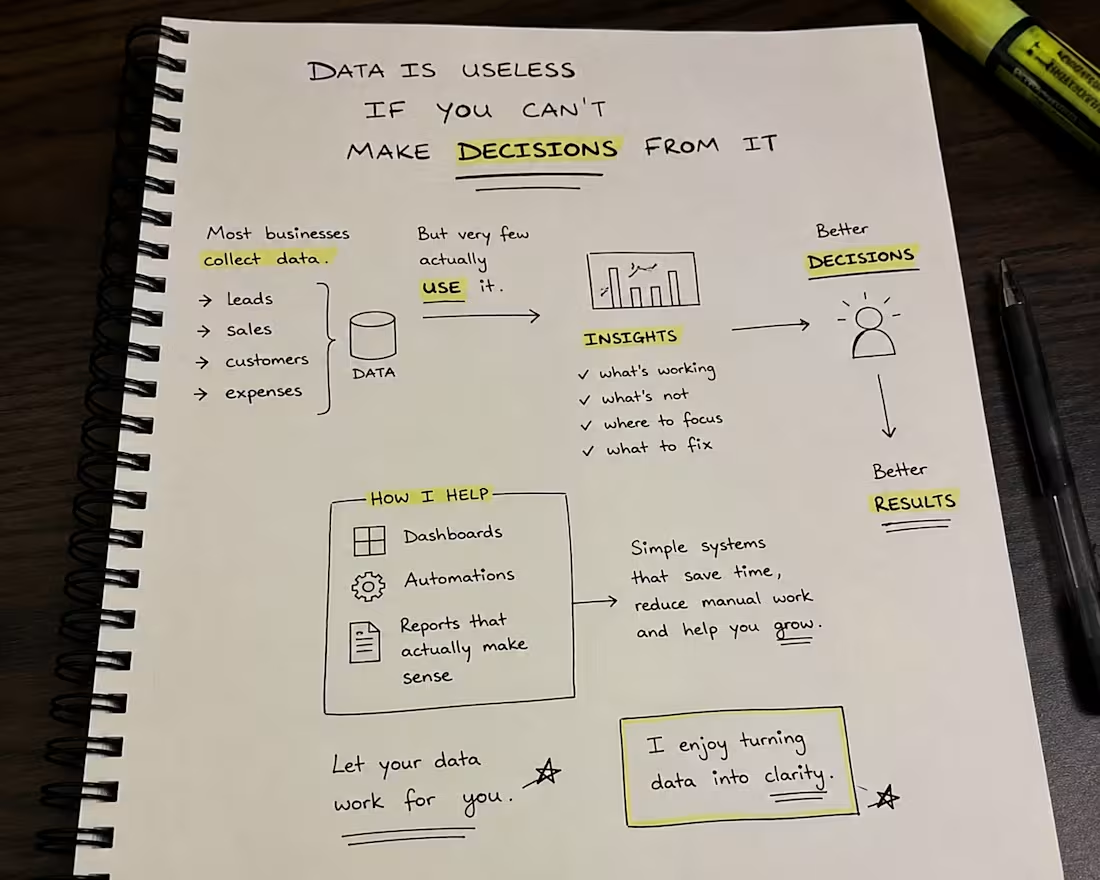
I used to think dashboards were just about making data look good.
The more I worked with data, the more I realized that's not the point.
A good dashboard should answer questions instantly.
• What's working?
• What needs attention?
• What should I do next?
If you still have to open five spreadsheets to find those answers, your data isn't really working for you.
That's the kind of problem I enjoy solving.
3
135