
Abhi Chrayat
Data Analyst | SQL | Python | Excel | Power BI
New to Contra
Abhi is building their profile!

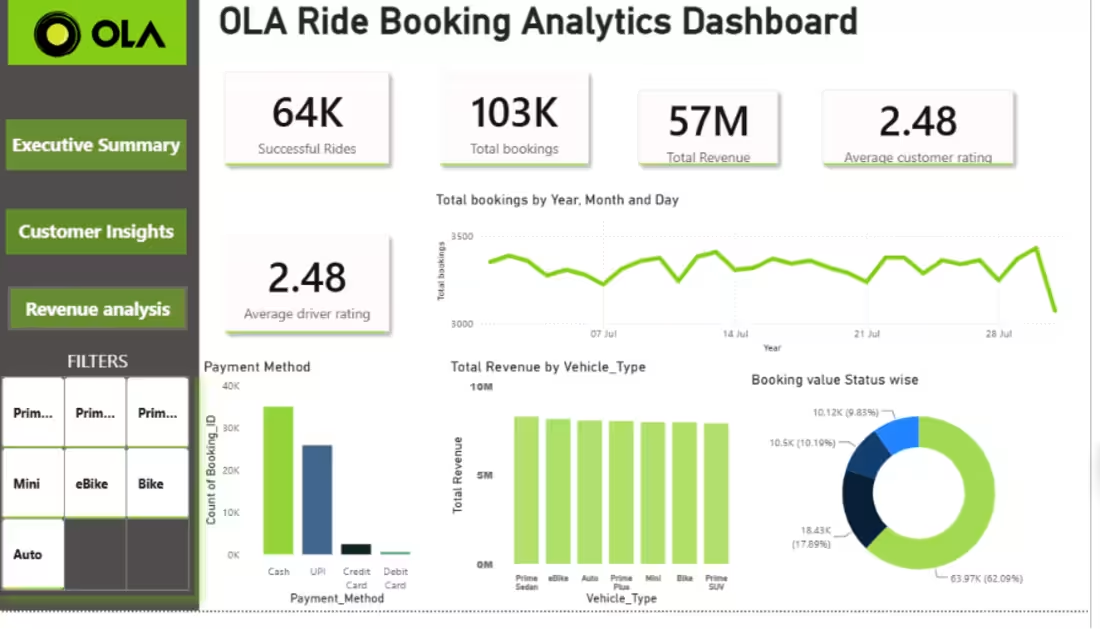
I built an interactive Ola Ride Booking Analytics Dashboard to analyze ride bookings, successful rides, revenue, customer ratings, driver ratings, vehicle types, payment methods, and booking status.
The dashboard includes key performance indicators, booking trends, revenue analysis, vehicle-type performance, payment-method analysis, and booking-status insights.
Tools used: Power BI, SQL, Python, Excel, DAX, and Data Visualization.
The goal was to transform ride-booking data into an interactive dashboard that makes it easier to identify business trends, customer behavior, revenue patterns, and operational insights.
0
11
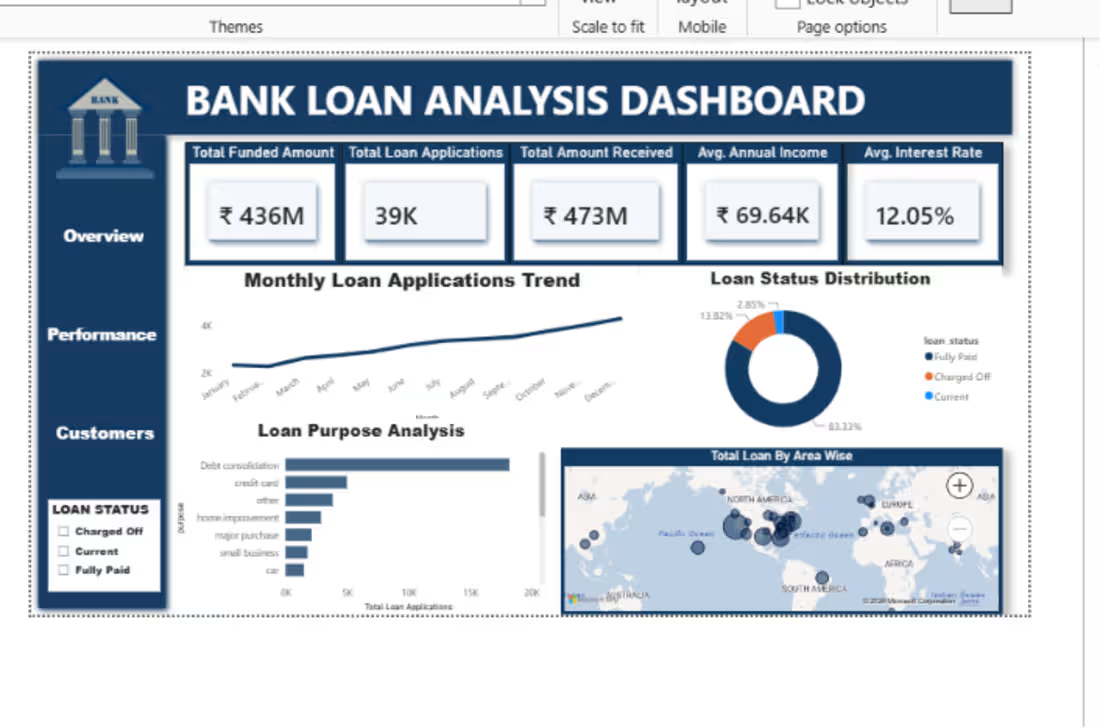
I built an interactive Bank Loan Analysis Dashboard to analyze loan applications, funded amounts, repayments, loan status, customer segments, loan purposes, and regional performance.
The dashboard includes key KPIs, monthly loan application trends, loan status distribution, loan purpose analysis, and geographic loan analysis.
Tools used: Power BI, Excel, DAX, and Data Analysis.
The goal was to transform loan data into a clear and interactive dashboard that helps businesses understand lending performance and identify important trends.
0
18
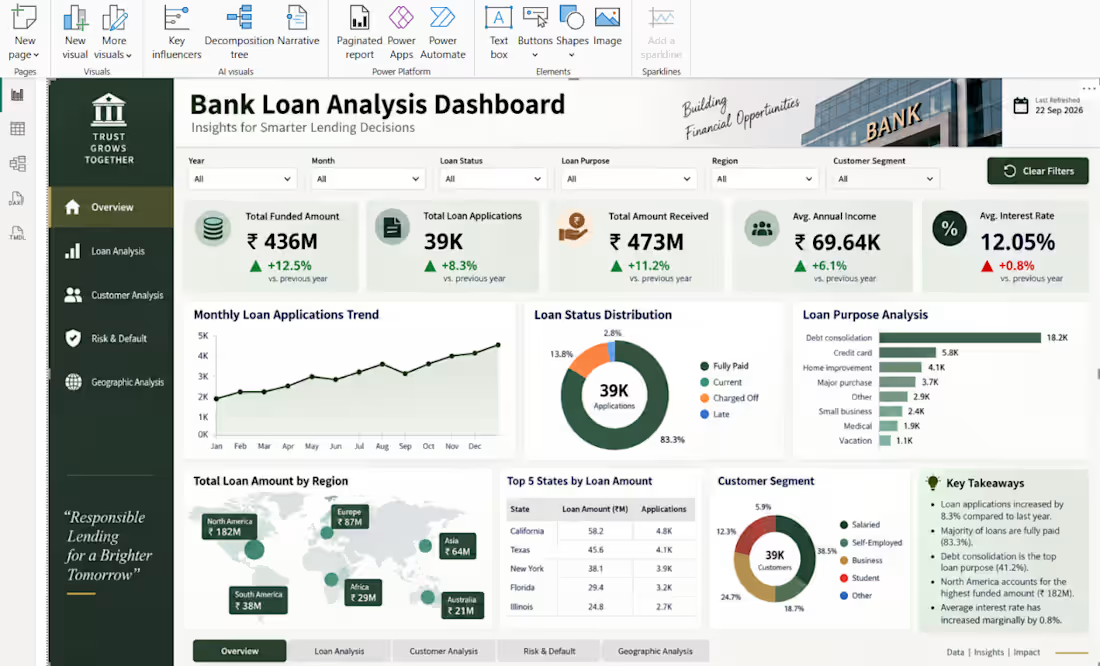
I created an interactive Bank Loan Analysis Dashboard to analyze loan applications, funded amounts, repayments, customer segments, loan purposes, risk, and regional performance.
The dashboard includes KPIs, monthly loan trends, loan status distribution, loan purpose analysis, regional analysis, customer segmentation, and key business insights.
Tools used: Power BI, Excel, DAX, Data Analysis, and Data Visualization.
The goal was to turn raw loan data into a clear dashboard that helps identify lending trends, customer patterns, and important business insights.
0
20
I created an interactive Instacart Product Dashboard to analyze product purchases, orders, reorder behavior, departments, and product performance.
The dashboard includes key KPIs, top products, reorder rates, department-level analysis, cart position analysis, and business insights.
Tools used: Power BI, Excel, Data Analysis, Data Visualization.
The goal was to turn raw product and order data into a simple dashboard that helps identify purchasing patterns and important business insights.
0
21