The network for creativity
Join 1.25M professional creatives like you
Connect with clients, get discovered, and run your business 100% commission-free
Creatives on Contra have earned over $150M and we are just getting started
Back to feedPost
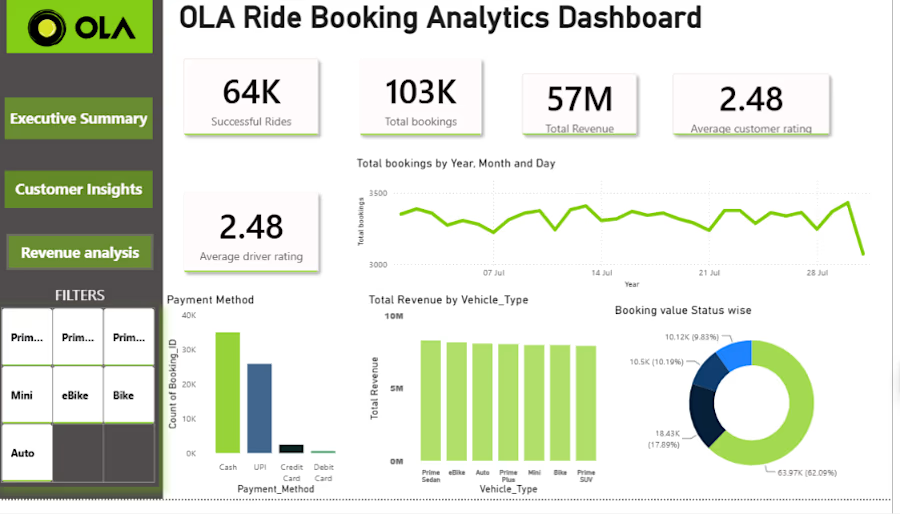
I built an interactive Ola Ride Booking Analytics Dashboard to analyze ride bookings, successful rides, revenue, customer ratings, driver ratings, vehicle types, payment methods, and booking status.
The dashboard includes key performance indicators, booking trends, revenue analysis, vehicle-type performance, payment-method analysis, and booking-status insights.
Tools used: Power BI, SQL, Python, Excel, DAX, and Data Visualization.
The goal was to transform ride-booking data into an interactive dashboard that makes it easier to identify business trends, customer behavior, revenue patterns, and operational insights.


The network for creativity
Join 1.25M professional creatives like you
Connect with clients, get discovered, and run your business 100% commission-free
Creatives on Contra have earned over $150M and we are just getting started





Related posts

I created an interactive Instacart Product Dashboard to analyze product purchases, orders, reorder behavior, departments, and product performance.
The dashboard includes key KPIs, top products, reorder rates, department-level analysis, cart position analysis, and business insights.
Tools used: Power BI, Excel, Data Analysis, Data Visualization.
The goal was to turn raw product and order data into a simple dashboard that helps identify purchasing patterns and important business insights.

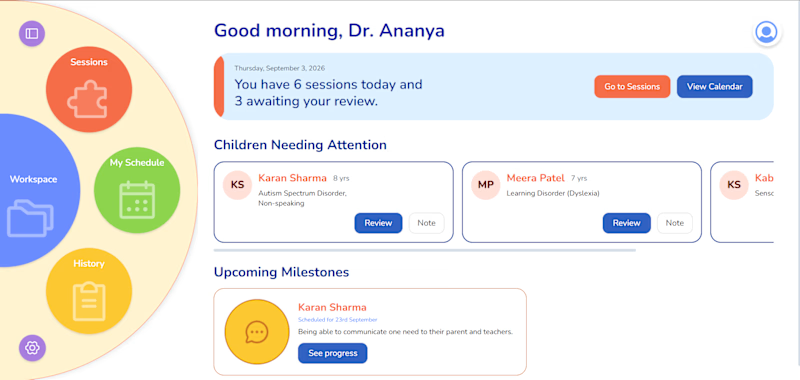
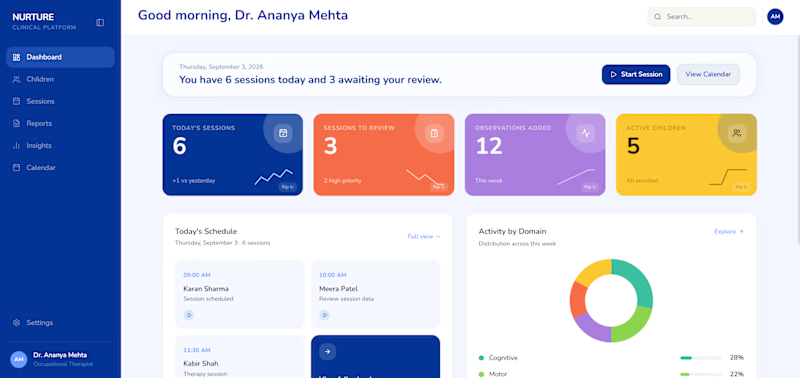
Which dashboard works better for an Occupational therapist?

2 voted
40%
3 voted
60%
5 votes
Closed

Dashboard should be for how much data can be scanned in the shortest time possible.
Bright Colors are distraction here.

🚀 BrightMart Retail Sales & Performance Dashboard
I recently designed and developed this interactive Power BI dashboard as part of a job assignment. The goal was to analyze retail sales, customer trends, and product performance for BrightMart.
📊 Key Features:
• KPI Summary: Tracking Total Sales ($2.03M), Total Orders, Quantity, and Customers.
• CY vs. PY Revenue: Monthly sales trend comparison between the current and previous year.
• Top/Bottom Performers: Dynamic toggle to instantly view top 10 and bottom 10 products.
• Interactive Slicers: Custom collapsible panel to filter by Region, Category, and Brand.
• Data Modeling: Built on a Star Schema model with custom DAX measures for optimal performance.
This project was created as a job assessment task to demonstrate end-to-end data transformation, modeling, and dashboard visualization.
Feedback and suggestions are welcome! 👇
#PowerBI #DataAnalytics #BusinessIntelligence #DataVisualization #RetailAnalytics #PowerBIDashboard #DAX #DataAnalysis #JobAssignment #Portfolio #Analytics
Data AnalysisMicrosoft Power BImicrosoftfabricGoogle GeminiBusiness StrategyData EngineeringMicrosoft Excel

