
I completed @Rive's Data Binding challenge on @Contra
I thought the best way to visualize live world data was to create a dynamic weather widget. ☀️
I successfully created the necessary inputs within Rive and connected them to the design via the Data Binding panel, as you can see in the video. This setup is ready to visualize live weather data, and the result is this visual spectacle! I truly enjoyed working on this challenge! 🙌
I also added a little extra fun: Don't forget to look for the Santa 🎅🏼 and Special Day Easter Eggs hidden inside the widget!
2
12
247
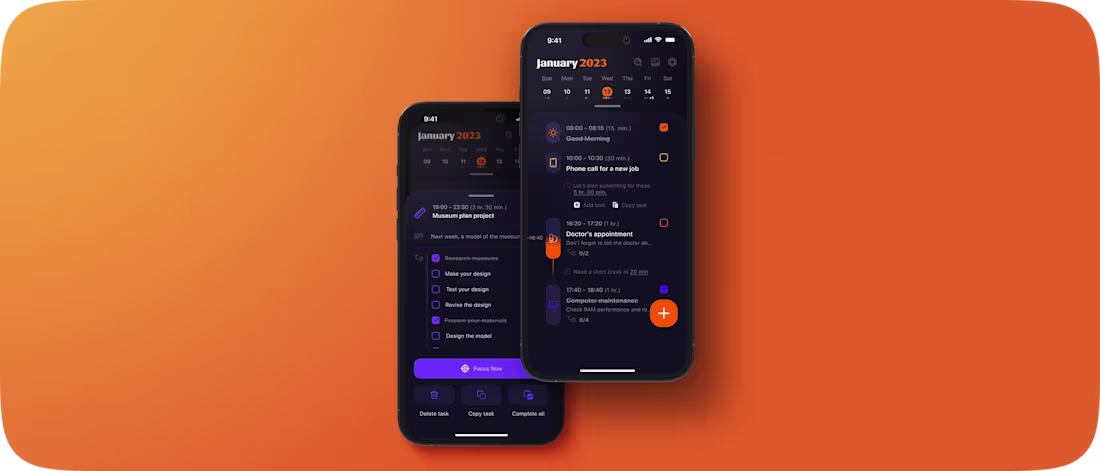
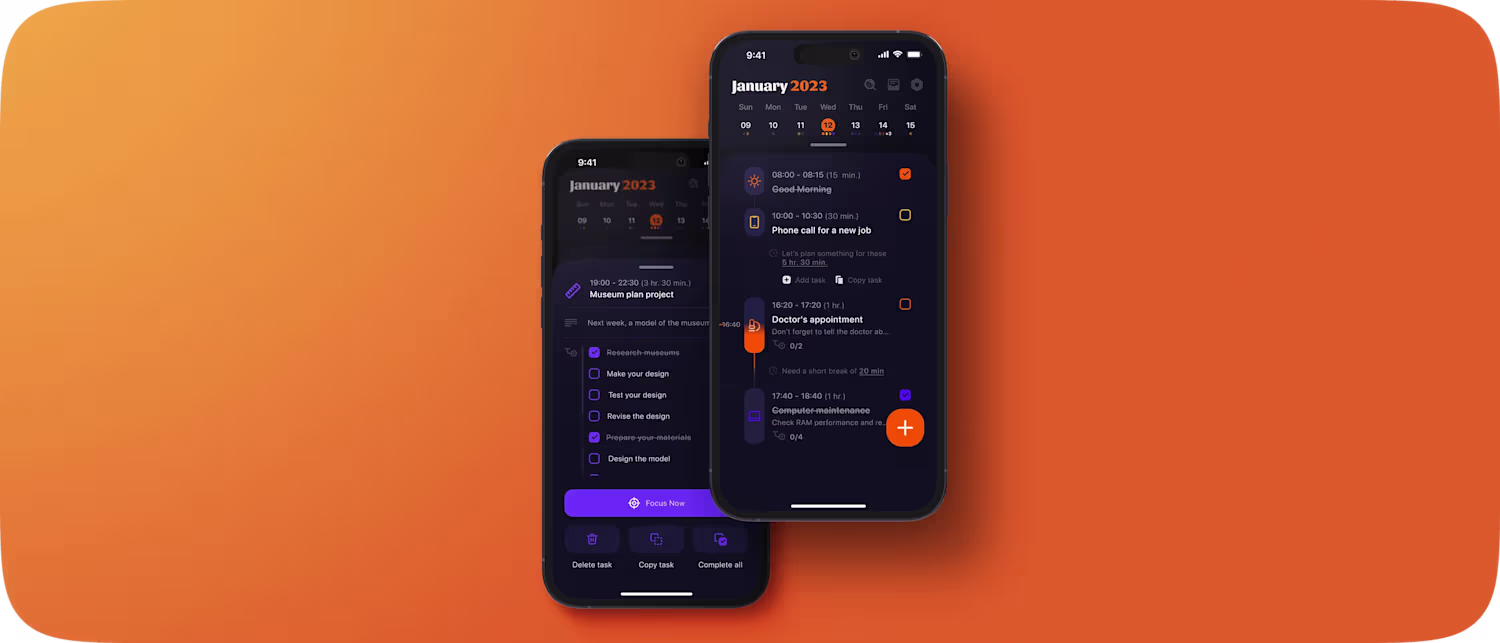
Welldone Daily Planner app design inspired by the Structured app
0
3