
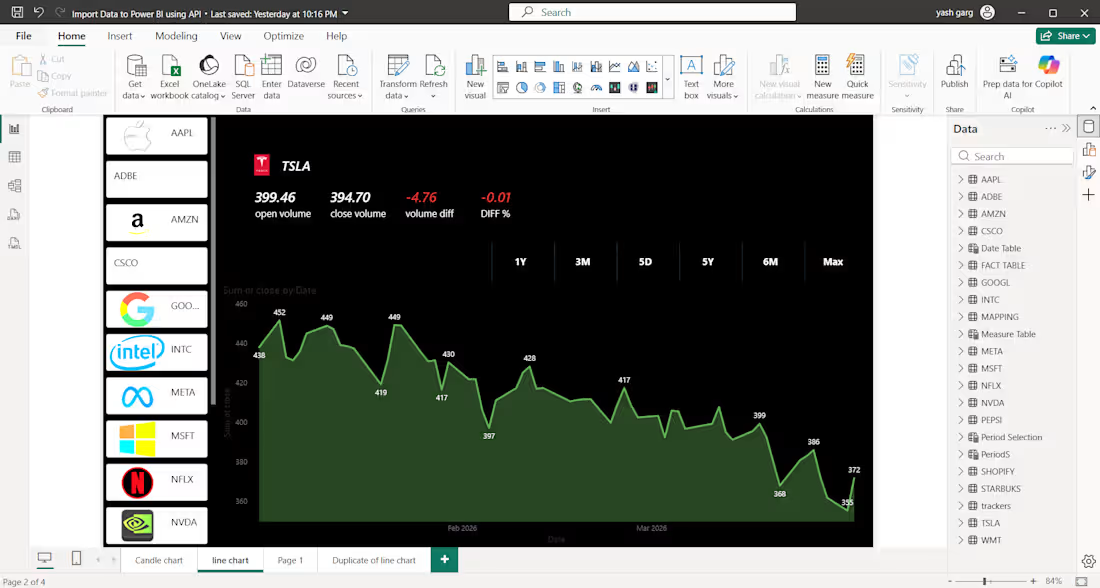
📊 Real-Time Stock Market Dashboard | Power BI + API Integration
I built a live stock market tracking dashboard in Power BI, pulling real-time price data via API for major tech stocks — AAPL, AMZN, GOOGL, MSFT, TSLA, META, NVDA, and more.
What it includes:
🕯️ Candlestick chart with open/close volume, daily diff %, and time-range filters (5D, 1M, 3M, 6M, 1Y, 5Y, Max)
📈 Trend line view tracking closing price movement over time with peak/dip annotations
🔥 Heatmap matrix comparing daily % change across 15+ stocks at once — instantly spot which tickers were up or down on any given day
🎨 Custom dark-themed UI with brand logos for quick visual scanning
The goal was to turn raw, constantly-updating market data into something a trader or analyst could scan in seconds — no digging through spreadsheets, just clean visuals that highlight what matters.
Tools used: Power BI, API data import, DAX measures, custom visuals, dynamic date filtering.
Open to building similar dashboards — finance, crypto, e-commerce, or business analytics. DM me if you need raw data turned into decisions. 📩
2
56
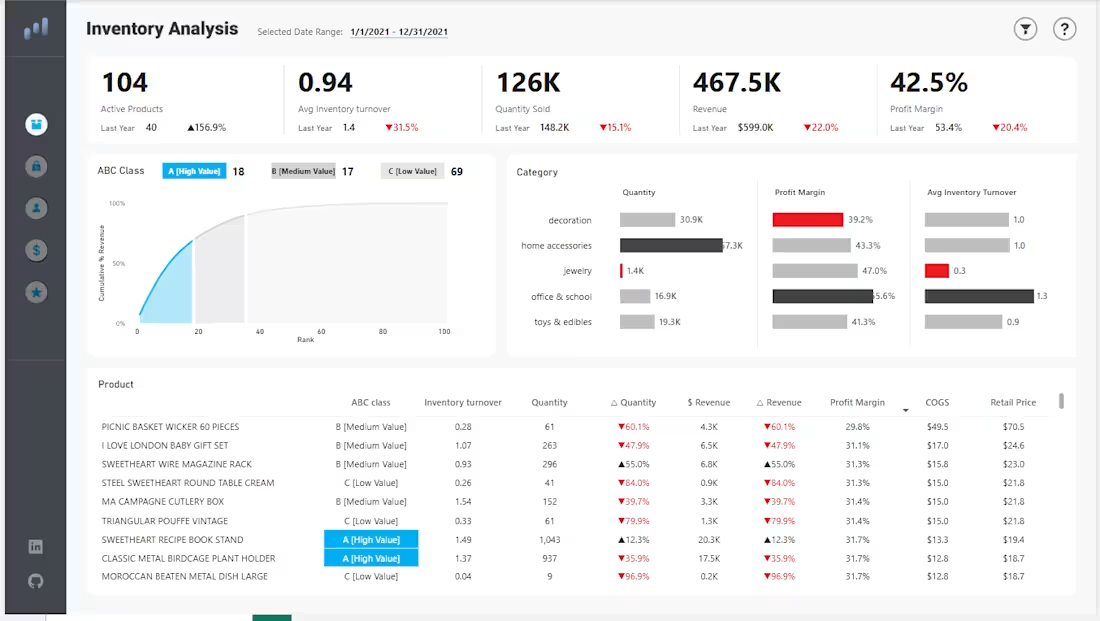
This is an Inventory Analysis dashboard covering 1/1/2021 – 12/31/2021, likely built in a BI tool (Power BI/Tableau style). Here's the breakdown:
Top-line KPIs (vs. last year):
104 active products (▲156.9% — big jump from 40)
0.94 avg inventory turnover (▼31.5%)
126K units sold (▼15.1%)
$467.5K revenue (▼22.0%)
42.5% profit margin (▼20.4%)
So despite nearly tripling the product count, sales volume, revenue, and margin all declined — a sign the assortment expanded but efficiency dropped.
ABC Classification (Pareto/80-20 analysis by revenue contribution):
A [High Value]: 18 products
B [Medium Value]: 17 products
C [Low Value]: 69 products — the majority of SKUs contribute the least revenue
1
38