

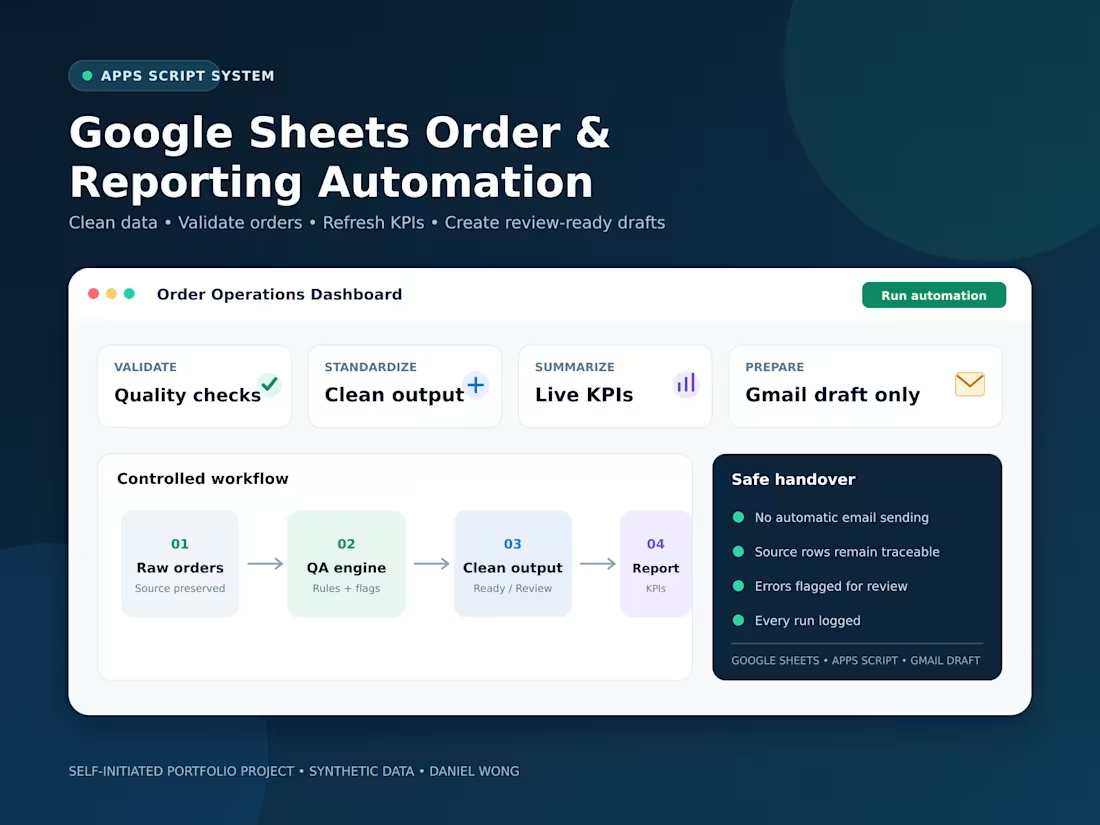
This self-initiated portfolio project demonstrates a controlled Google Sheets workflow built with Google Apps Script. The solution standardizes order data, flags duplicate IDs and invalid fields, separates Ready and Review records, refreshes KPI summaries, and records every run in an audit log. It can also create a review-ready Gmail draft without sending email automatically. Built with synthetic data.
0
19
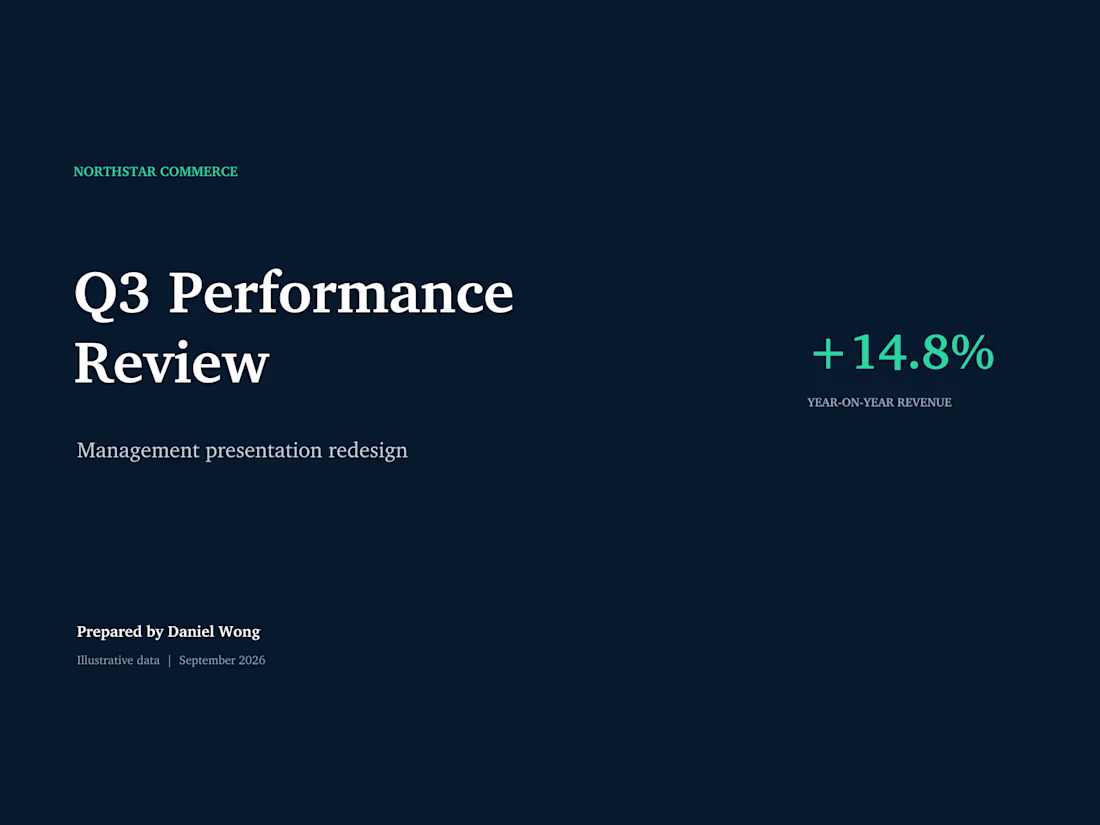
This self-initiated portfolio project demonstrates how scattered management figures can be turned into a concise, decision-focused presentation.
I created a six-slide quarterly performance deck for a fictional company using synthetic data. The presentation covers executive KPIs, revenue trends, regional performance, customer retention and Q4 priorities.
The charts are native PowerPoint objects, so the figures, text and visual elements remain editable for practical handover. The final structure is designed for recurring management reporting and can be updated for future reporting periods.
This project does not represent a paid client engagement.
0
28
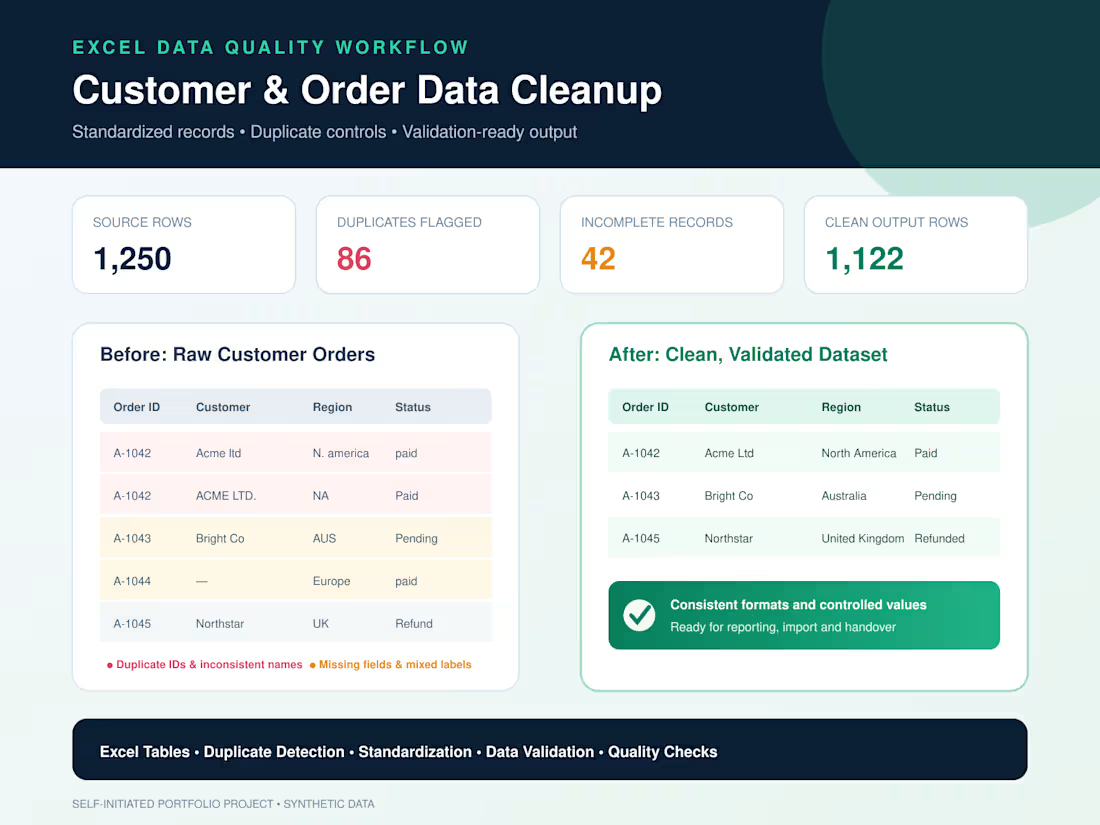
This self-initiated portfolio project demonstrates a structured customer and order data-cleaning workflow in Excel.
I reviewed 1,250 synthetic source records, standardized inconsistent customer names, regions and order statuses, identified 86 duplicate order records, and flagged 42 incomplete records. The process produced 1,122 clean output rows ready for reporting, system import or operational handover.
I used Excel Tables, formulas, conditional formatting, data validation and documented quality checks to make the cleanup process accurate, repeatable and easy to review.
Note: This project uses synthetic data.
0
30
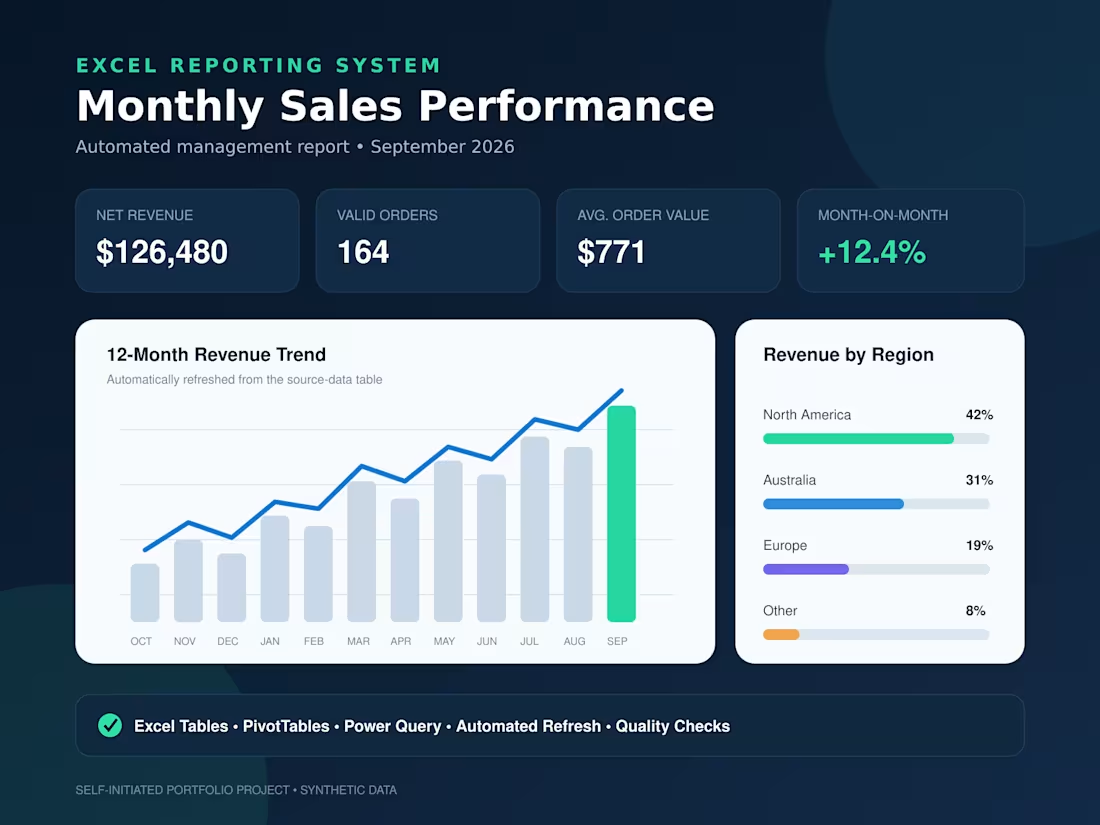
This self-initiated portfolio project demonstrates an automated monthly sales reporting workflow in Excel. I structured synthetic transaction data into an Excel Table, added quality checks, and created PivotTable summaries for revenue, orders, average order value, monthly trends and regional performance.
The report is designed for quick monthly updates: append the latest source data, refresh the report, and review the updated KPIs. The finished dashboard presents 12 months of performance in a clear, management-ready format.
Note: This portfolio project uses synthetic data.
0
43