The network for creativity
Join 1.25M professional creatives like you
Connect with clients, get discovered, and run your business 100% commission-free
Creatives on Contra have earned over $150M and we are just getting started
Back to feedPost

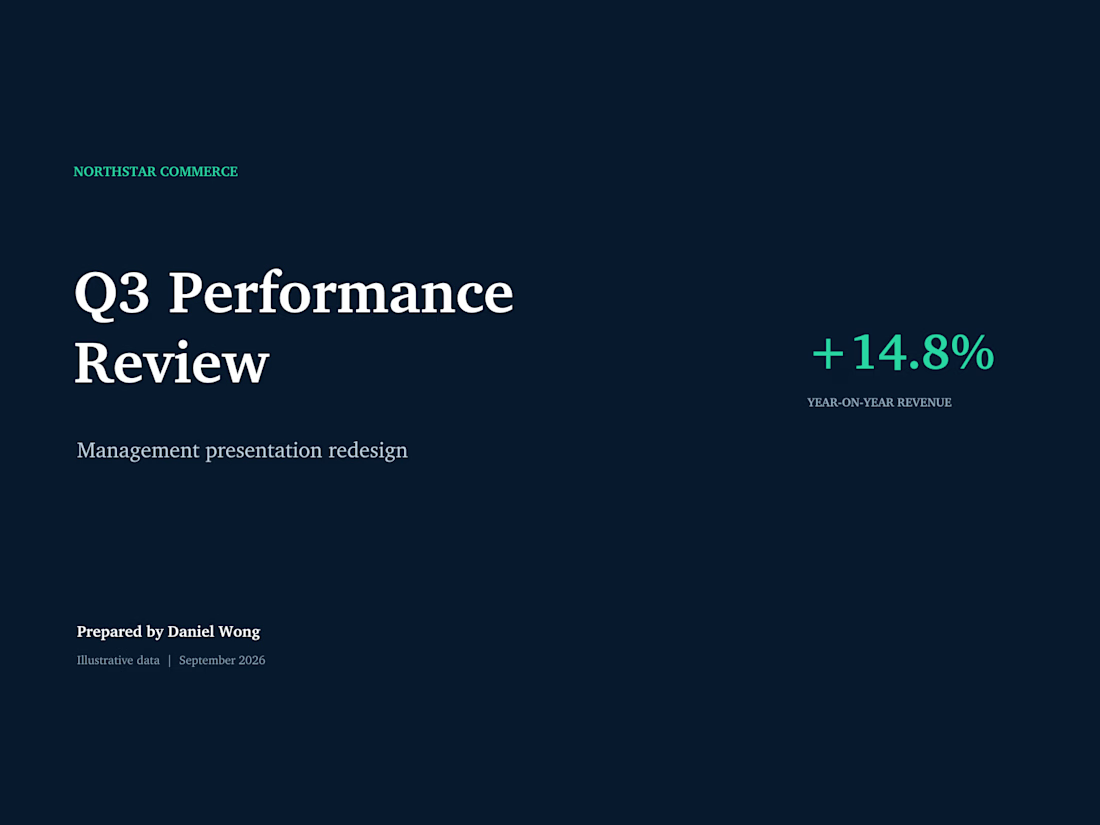
This self-initiated portfolio project demonstrates how scattered management figures can be turned into a concise, decision-focused presentation.
I created a six-slide quarterly performance deck for a fictional company using synthetic data. The presentation covers executive KPIs, revenue trends, regional performance, customer retention and Q4 priorities.
The charts are native PowerPoint objects, so the figures, text and visual elements remain editable for practical handover. The final structure is designed for recurring management reporting and can be updated for future reporting periods.
This project does not represent a paid client engagement.
Business AnalysisData VisualizationMicrosoft ExcelMicrosoft Power BIPresentation DesignMicrosoft PowerPoint


The network for creativity
Join 1.25M professional creatives like you
Connect with clients, get discovered, and run your business 100% commission-free
Creatives on Contra have earned over $150M and we are just getting started







Related posts

Fold & Brew — Modern Brand Identity & Logo Design
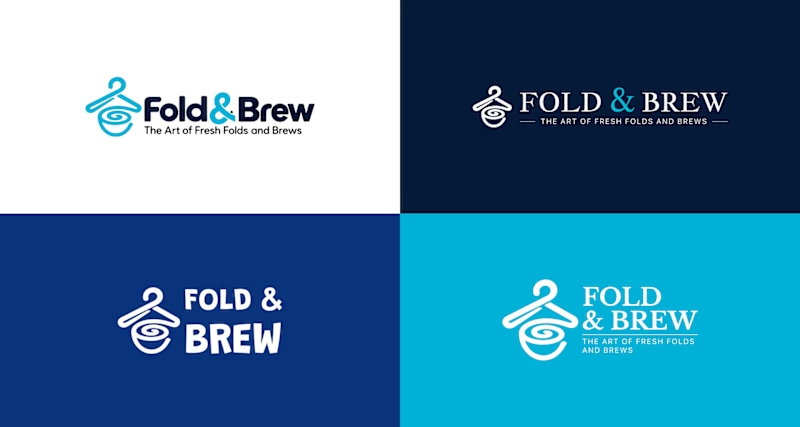
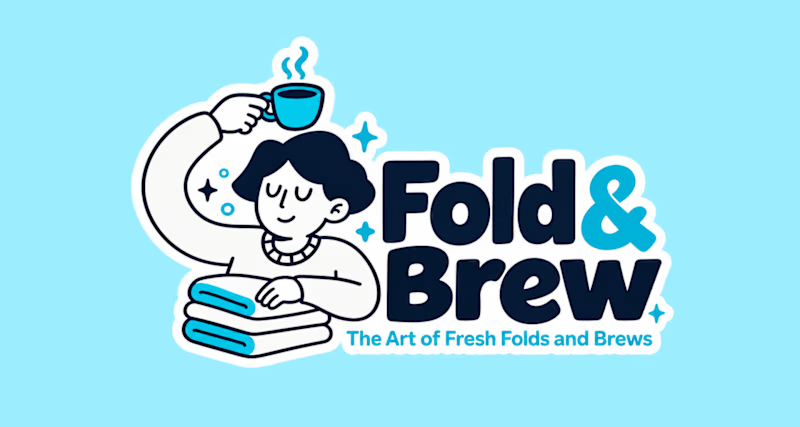
Fold & Brew is a modern laundry & café concept that brings together two everyday experiences — fresh folds and fresh brews.
For the brand identity, I created a distinctive logo that combines a clothes hanger with a coffee cup/swirl, creating a simple visual connection between laundry and coffee.


0 voted
0%
7 voted
100%
7 votes
Closed

Just woow

Thinking about moving from Excel or Google Sheets to a CRM? Don’t migrate the problems with the data.
Before choosing or configuring a CRM, I usually check five things:
• Does every active lead have a clear owner?
• Is there always a defined next action?
• Are follow-up dates consistently tracked?
• Are lead statuses clear and used consistently?
• Could another team member understand the spreadsheet without asking for help?
If several answers are “no”, the problem may not be the CRM yet — it may be the workflow behind it.
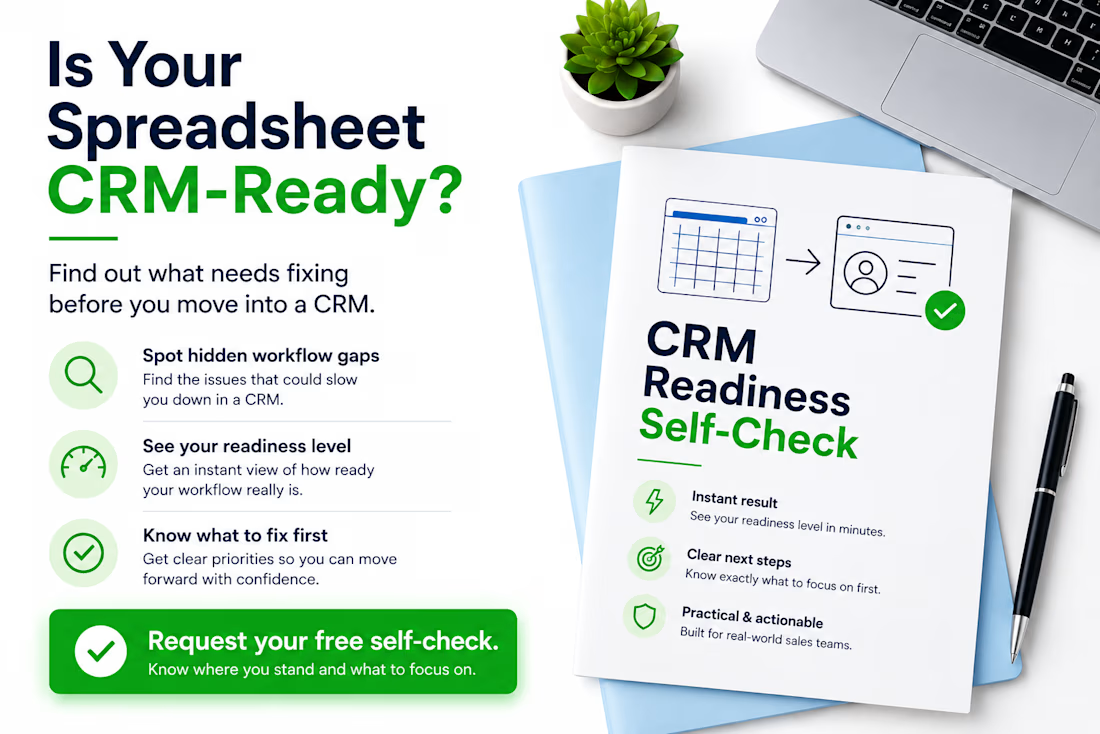
A CRM works much better when the sales process is clear before migration starts. I created a free CRM Readiness Self-Check for small teams that want to identify these gaps before investing more time or money in a CRM.
If you’re currently working from spreadsheets and considering a CRM, comment “CHECK” or send me a message and I’ll send it to you.
#CRM #CRMReadiness #SalesOperations #RevOps #WorkflowOptimization #GoogleSheets #Excel #BusinessProcess


Lead Product & UI/UX Designer
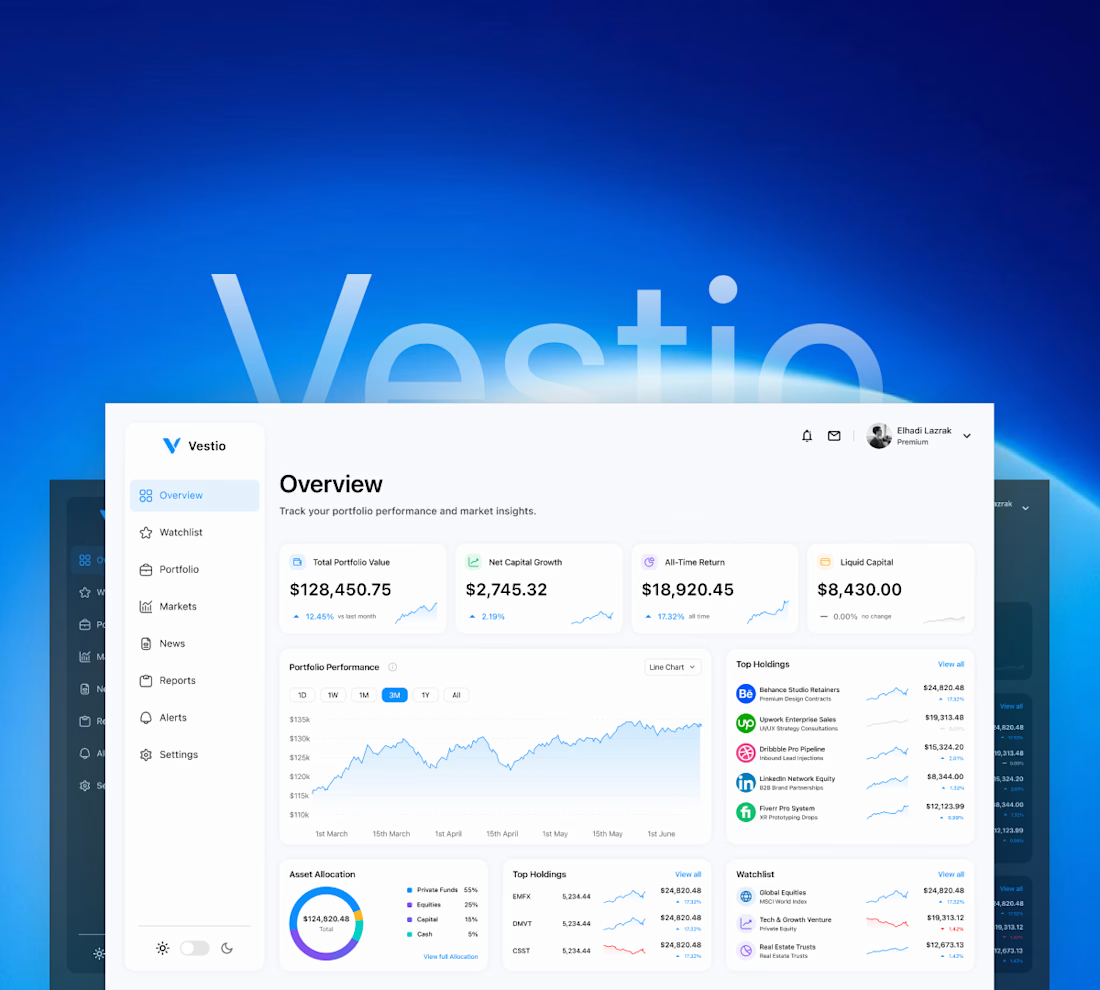
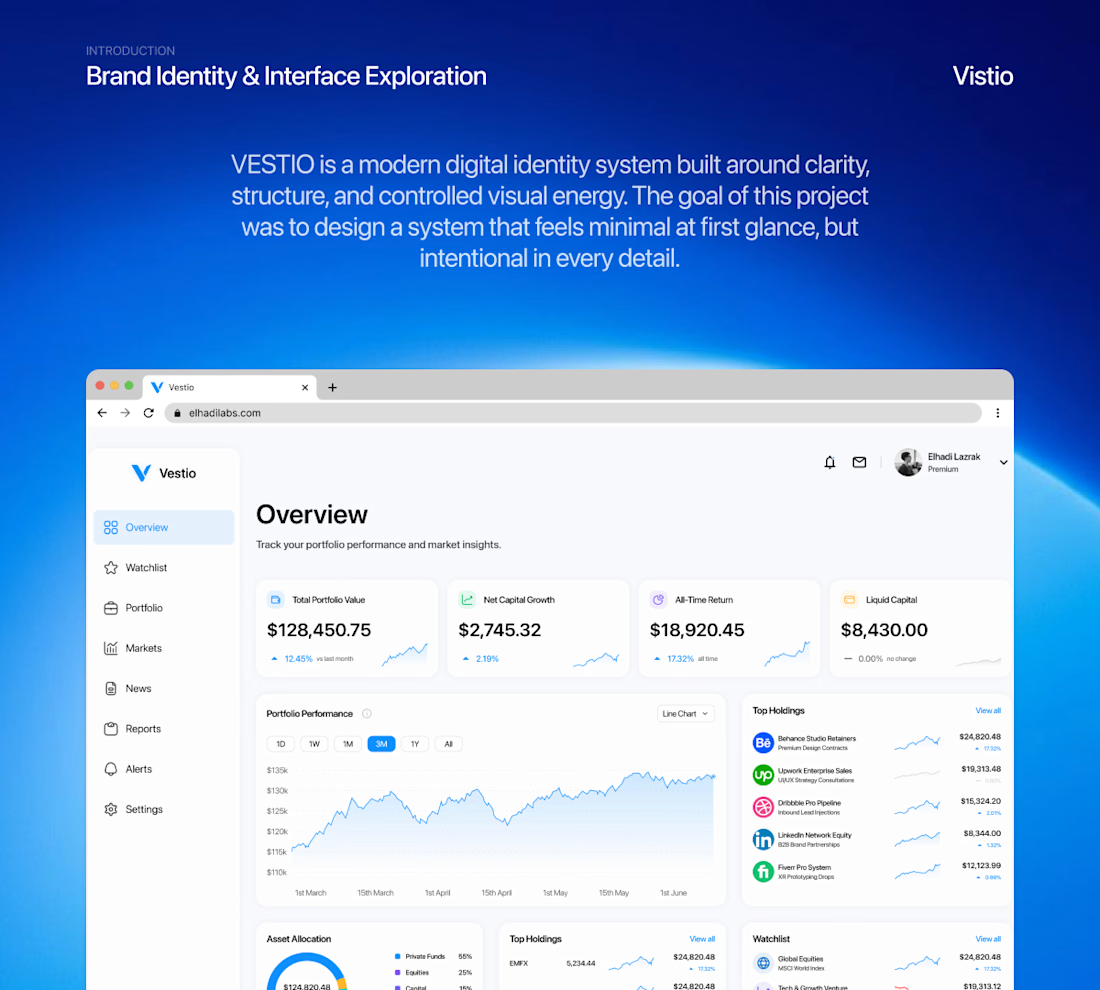
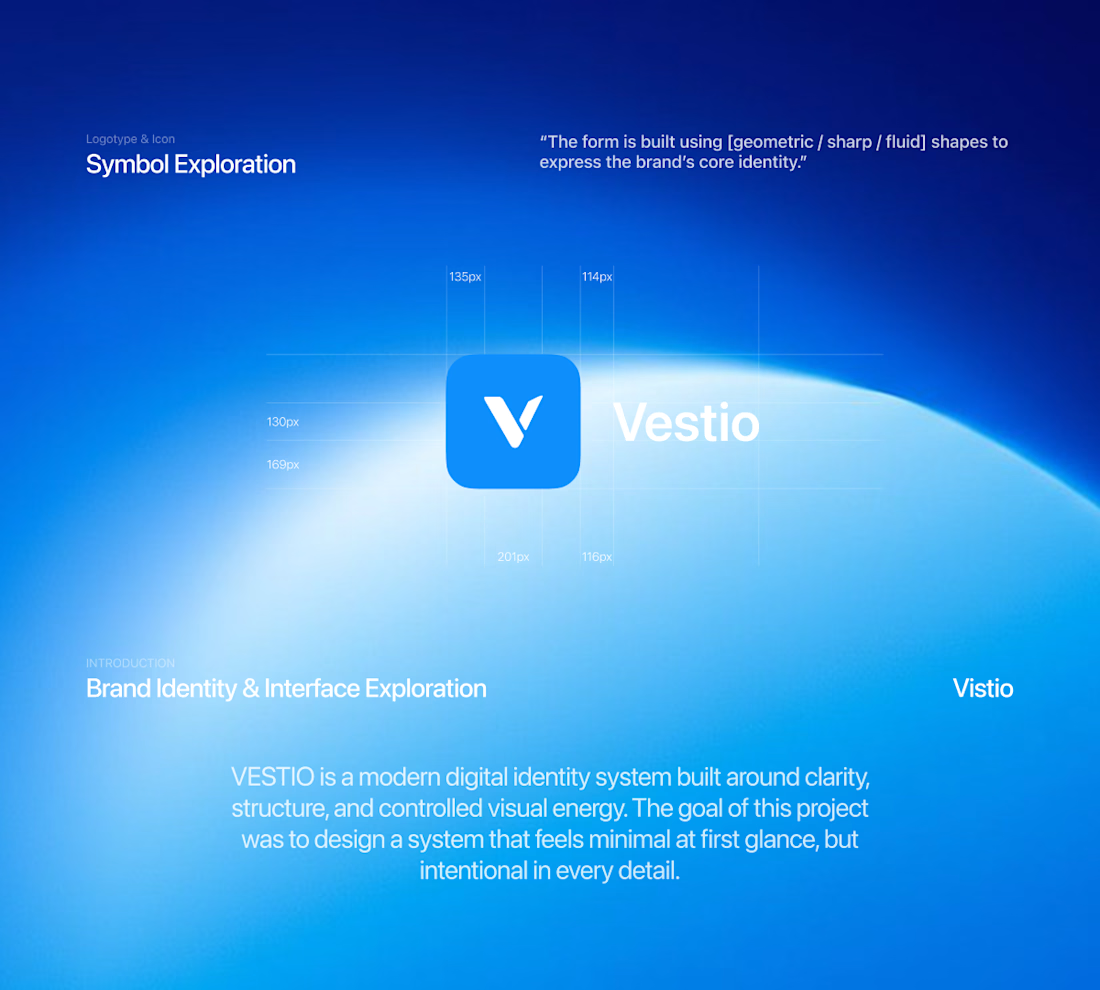
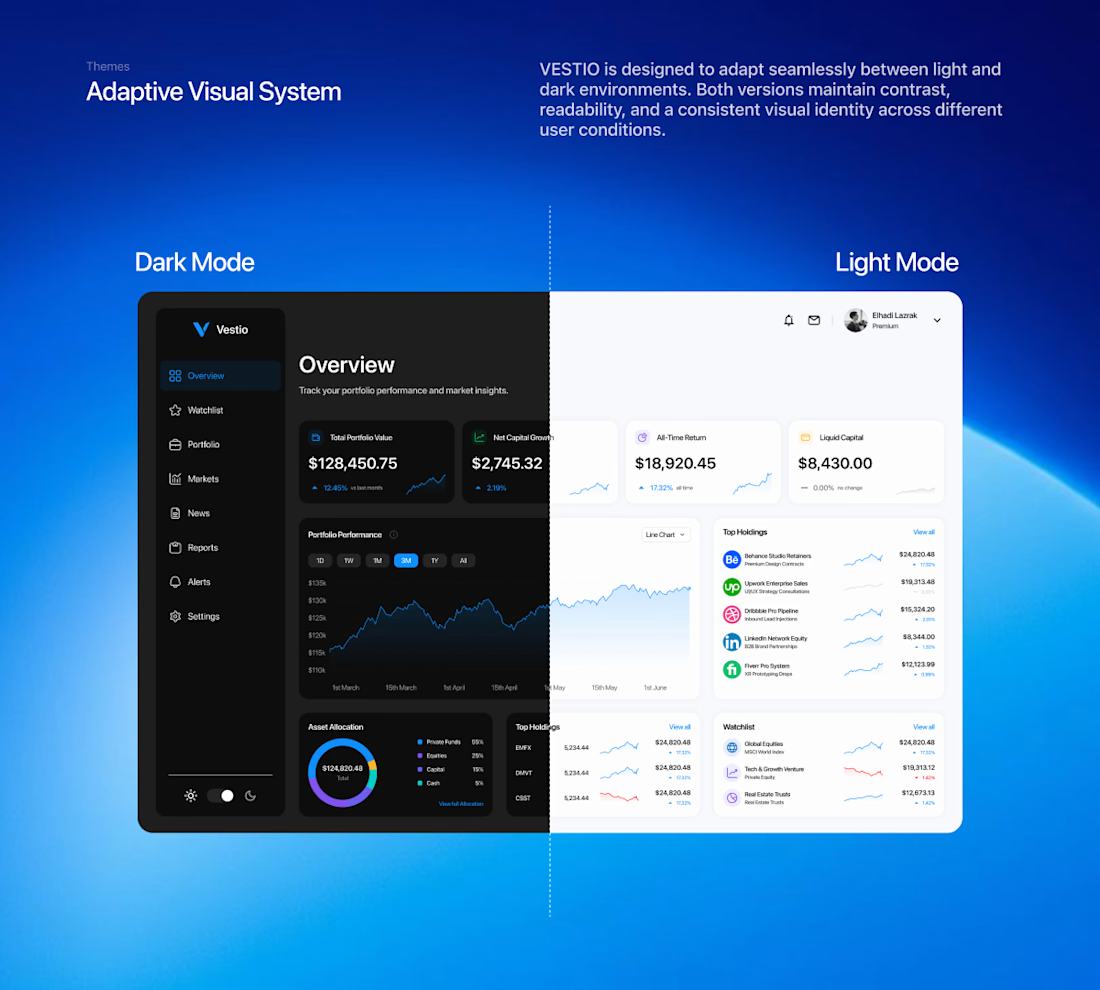
Engineered the end-to-end UI/UX architecture and visual strategy for Vestio, a Fintech SaaS ecosystem designed to simplify wealth management for digital creators and freelancers. I transformed fragmented, multi-channel income streams into intuitive data visualization frameworks, establishing a component-driven Figma design system featuring auto-layout components, custom chart UI widgets, and a dual-mode engine (Light & Dark) optimized for accessibility and user retention.



Clean overview! Why four KPI cards on top and not a single hero number?