

Data Analyst & Power BI Developer | Retail Analytics Specialist
I specialize in converting complex retail and e-commerce transactional data into high-impact, interactive dashboards. By leveraging advanced data modeling, ETL processes, and user-centric design, I help retail businesses monitor sales performance, track regional trends, and understand customer purchasing behaviors to drive growth and profitability.
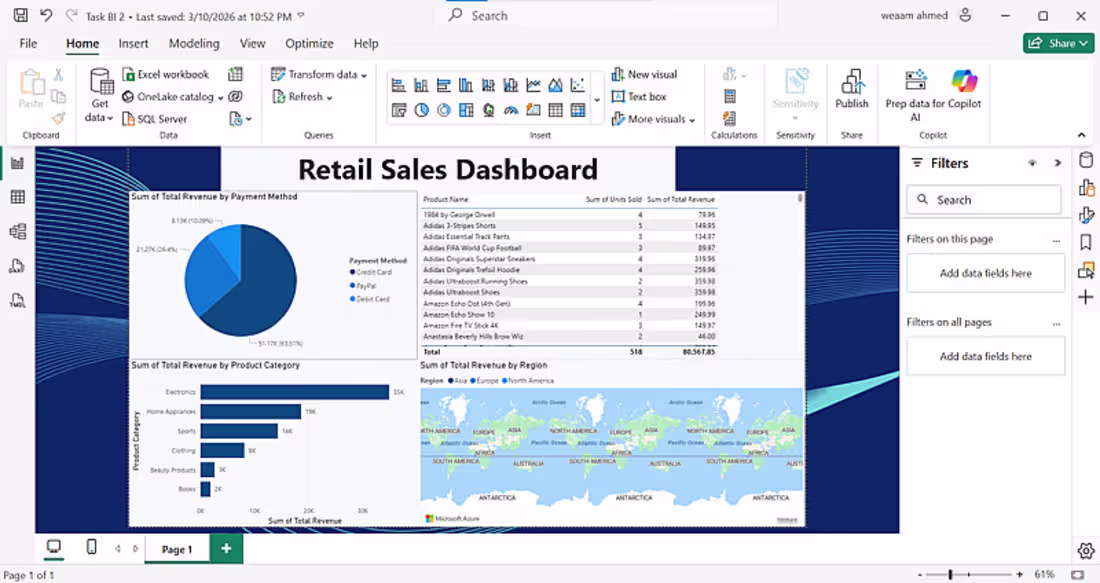
Featured Project: Retail Sales Dashboard
This project showcases a dynamic Retail Sales Dashboard designed in Microsoft Power BI to deliver comprehensive, real-time insights into retail performance across various dimensions.
Multi-Dimensional Analysis:
Sales by Category: Built horizontal bar charts analyzing Sum of Total Revenue by Product Category to identify top-performing product lines (such as Electronics, Home Appliances, and Sports).
Payment Method Distribution: Created a precise pie chart showing Sum of Total Revenue by Payment Method (Credit Card, PayPal, Debit Card) to help understand customer payment preferences.
Geographical Insights: Integrated an interactive map visual (Sum of Total Revenue by Region) to track sales distribution across international markets (North America, Europe, etc.).
Granular Product Performance: Designed a detailed data matrix table displaying Product Name, Sum of Items Sold, and Sum of Total Revenue for in-depth product-level auditing.
Professional Layout & ETL: Structured the data background for optimal performance and adopted a dark-themed, corporate visual identity that balances aesthetics with functional readability.
Technical Skills Applied
Tools: Microsoft Power BI, Power Query, Excel
Domain Expertise: Retail Analytics, Sales Forecasting, Revenue Analysis, Geospatial Data Mapping, Dashboard UI/UX Design
0
2
Business Intelligence & Data Analyst | Power BI Specialist
I transform raw, complex data into actionable, visually stunning dashboards that drive strategic business decisions. Specializing in data modeling, ETL processes, and interactive visualization, I help businesses uncover hidden trends, track key performance indicators (KPIs), and optimize their revenue streams.
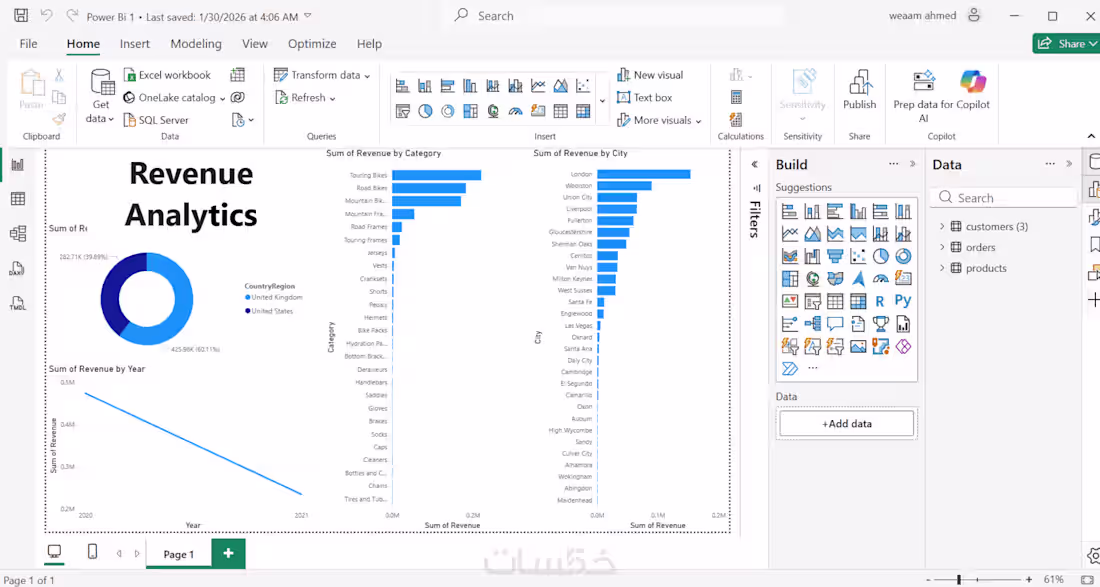
Featured Project: Revenue Analytics Dashboard
This project showcases a comprehensive Revenue Analytics Dashboard built using Microsoft Power BI to provide a 360-degree view of financial performance.
Data Integration & Modeling: Connected and structured multi-table data sources (Customers, Orders, and Products) into an optimized star schema for seamless reporting.
Advanced Visualizations: * Revenue Breakdown: Built dynamic bar charts analyzing Sum of Revenue by Category and Sum of Revenue by City to pinpoint top-performing markets and products.
Trend Analysis: Designed line charts (Sum of Revenue by Year) to track financial trajectories and growth velocity over time.
Proportional Insights: Utilized donut charts to display high-level revenue distributions at a glance.
User-Centric Design: Formatted with a clean, modern interface and intuitive filtering, allowing stakeholders to easily slice data and drill down into specific metrics.
Core Skills & Tools Applied
Tools: Microsoft Power BI, Power Query, Excel
Expertise: Data Visualization, Dashboard Design, ETL (Extract, Transform, Load), Data Modeling, Financial & Revenue Analytics
Looking to turn your data into a growth engine? Let’s connect and build a custom analytics solution tailored to your business goals.
0
6
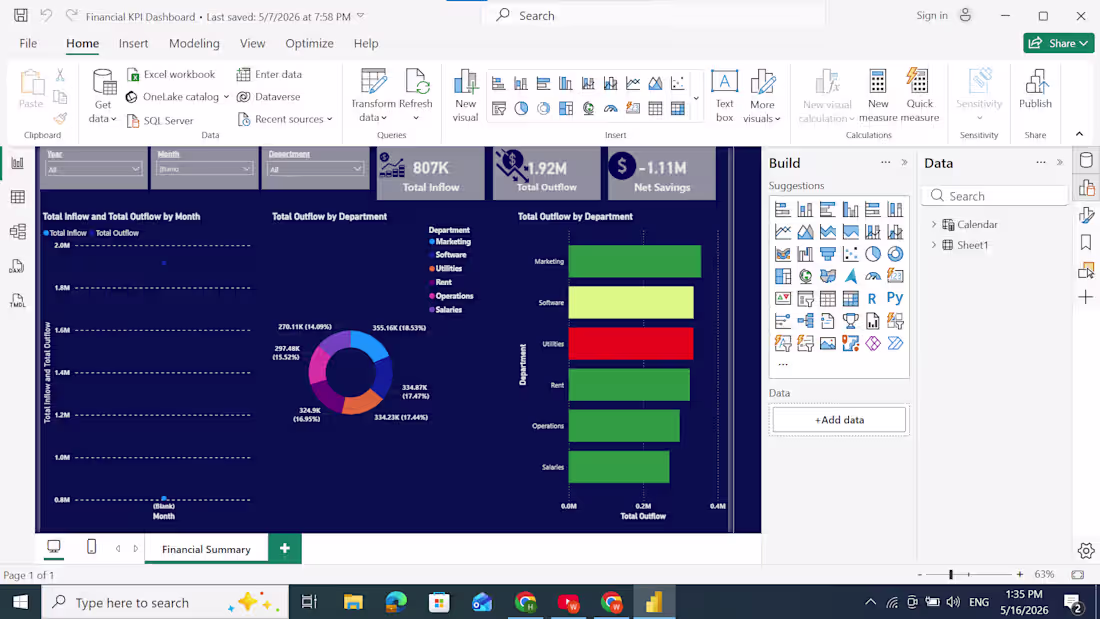
This interactive Financial KPI Dashboard was designed in Power BI to provide a clear and data-driven overview of financial performance. The dashboard analyzes key metrics including total inflow, total outflow, net savings, and departmental expenses through dynamic and easy-to-understand visualizations.
The project includes KPI cards, interactive filters, bar charts, donut charts, and monthly financial tracking to help businesses monitor performance, identify spending patterns, and support smarter decision-making.
Tools & Skills Used: Power BI, Data Cleaning, Data Visualization, KPI Tracking, Financial Analysis, Dashboard Design, and Business Reporting.
0
20