
Vikash Chandra
Helping businesses grow with data insights.
New to Contra
Vikash is building their profile!
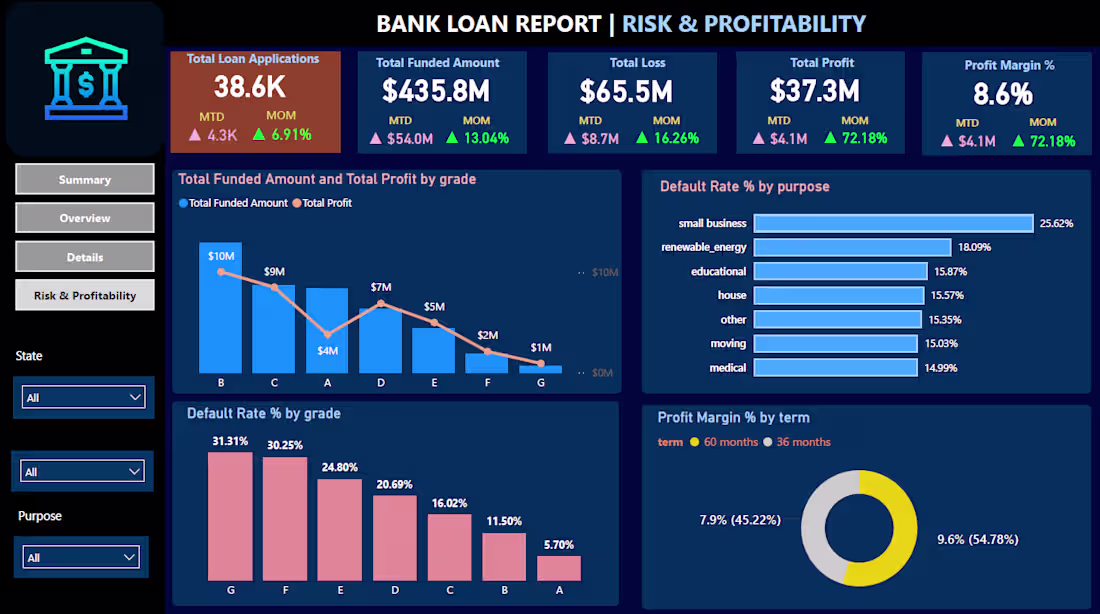
🏦 Bank Loan Analytics Dashboard | Credit Risk & Portfolio Analysis
Developed a comprehensive 4-page Bank Loan Analytics dashboard to evaluate loan performance, approval trends, borrower segmentation, and credit risk exposure. The solution provides executive-level KPI tracking, detailed risk breakdowns, borrower demographic insights, and loan status monitoring to support data-driven lending decisions.
The dashboard enables financial institutions to:
Monitor total funded vs approved loan amounts
Analyze loan approval and rejection trends
Identify high-risk borrower segments
Evaluate default rates and credit grade distribution
Track loan purpose and repayment performance
This project focuses on transforming raw lending data into actionable insights for risk management, underwriting optimization, and portfolio health monitoring.
1
2
77
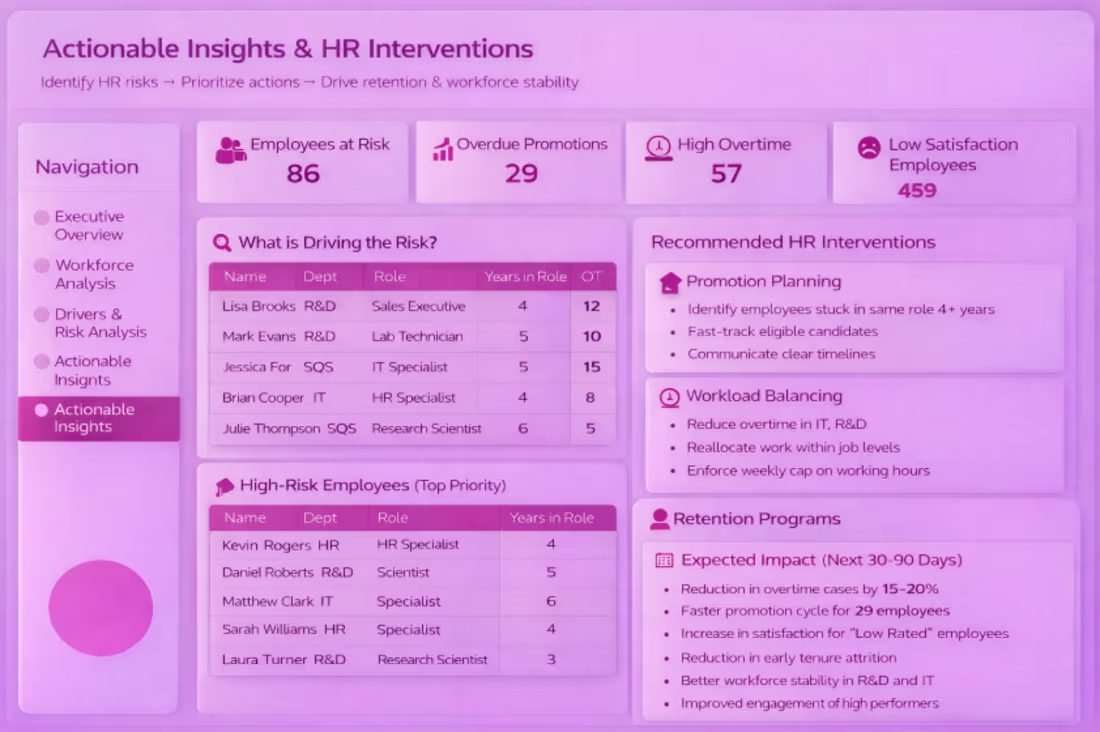
This page transforms analytical findings into strategic HR actions. It identifies high-risk employee segments, critical attrition drivers, and department-level concerns, enabling leadership to design targeted retention and workforce optimization strategies. The goal is to move from data analysis to data-driven decision-making.
0
37
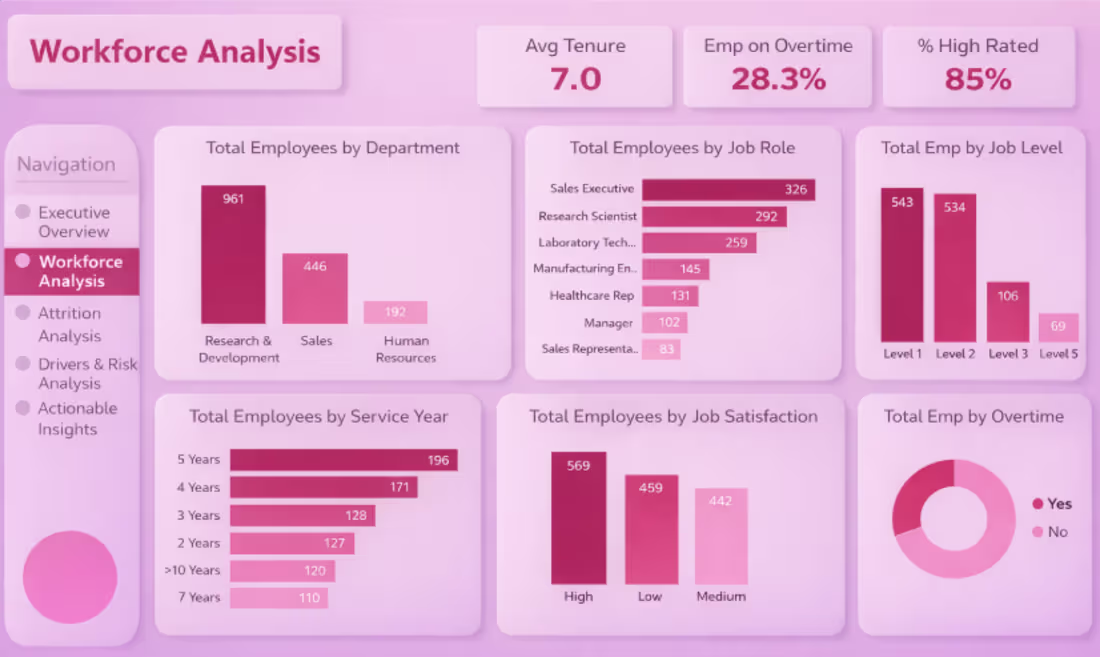
Built a multi-page HR Analytics dashboard to provide actionable insights into employee attrition, workforce distribution, and key retention drivers. The solution includes executive KPIs, demographic breakdowns, department-level analysis, and risk factor evaluation, enabling HR leaders to make informed decisions and improve workforce planning.
0
32
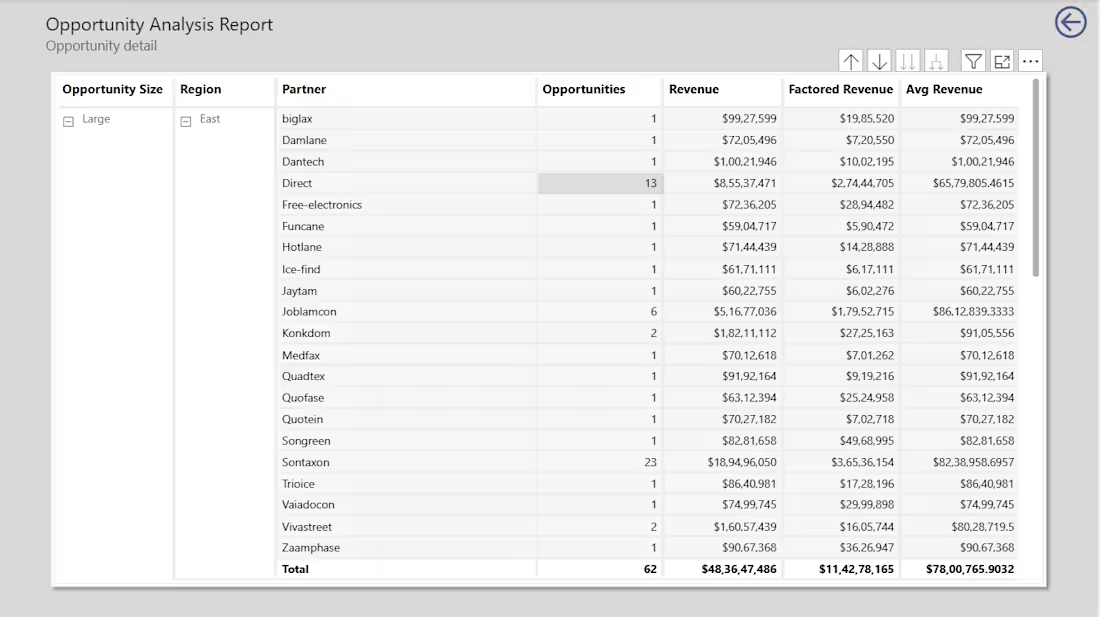
This provides a detailed breakdown of opportunities by size, region, and partner to enable deeper performance analysis. It includes opportunity count, total revenue, factored revenue, and average revenue to evaluate partner contribution and revenue concentration. The drill-down structure allows stakeholders to identify top-performing regions and partners for strategic decision-making.
0
47
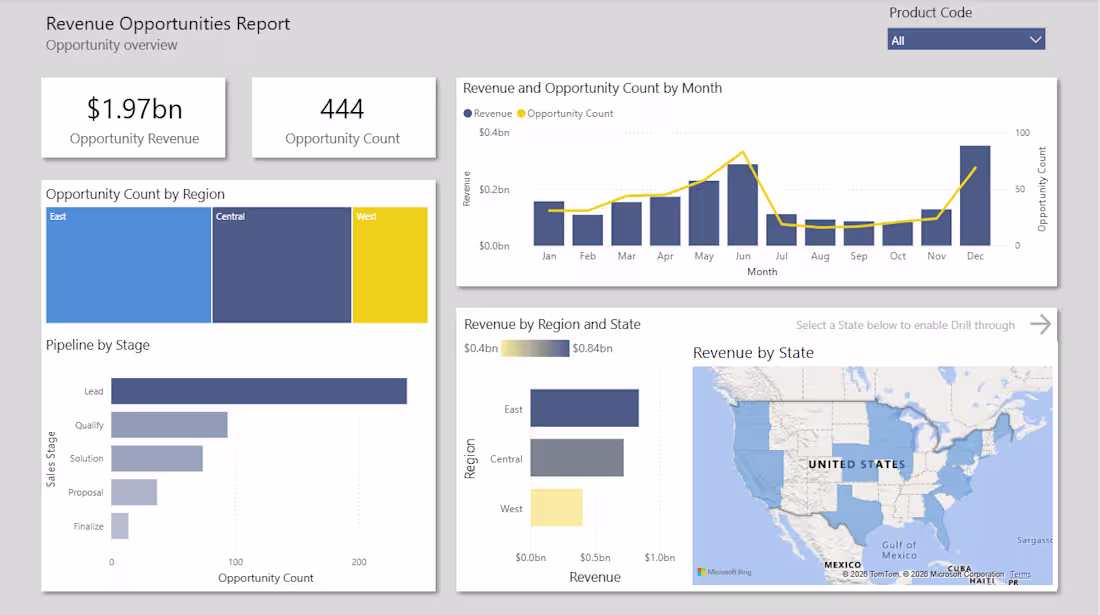
Designed and developed a Revenue Opportunities Dashboard to help businesses monitor opportunity performance, regional revenue distribution, and sales pipeline efficiency.
0
47