
📊 Excited to share my latest Excel dashboard project!
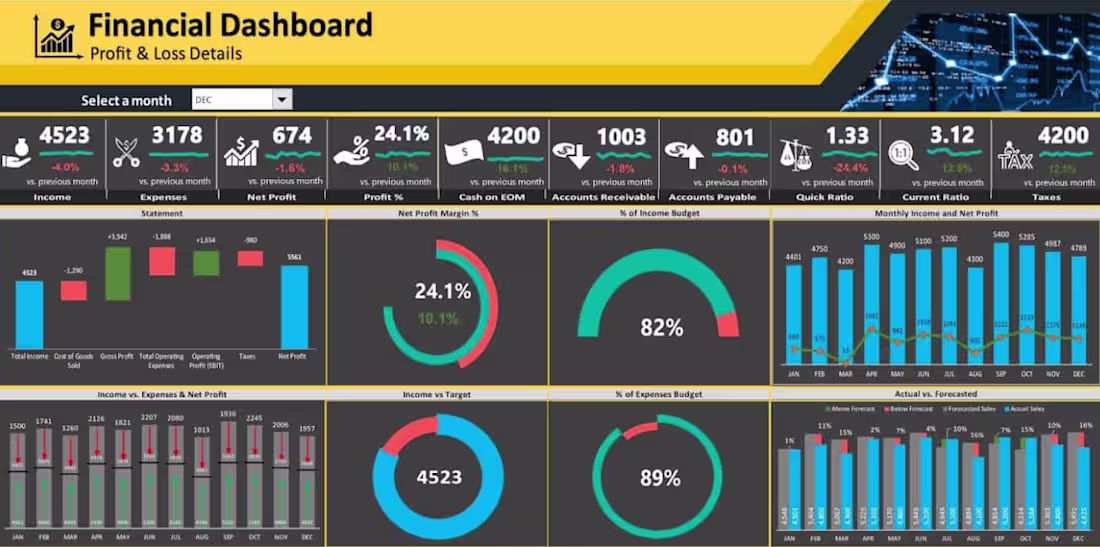
I built a financial profit & loss dashboard using Microsoft Excel to analyse business performance and generate actionable insights from sales data.
♦️ Key Highlights:
Sales & Profit Analysis
Region-wise Performance Tracking
Category & Sub-category Insights
Monthly Sales Trends
Interactive Pivot Tables & Charts
KPI Tracking Dashboard 🛠️ Tools Used:
Microsoft Excel
Pivot Tables
Pivot Charts
Data Cleaning
Dashboard Design ☑️ Through this project, I improved my skills in data analysis, business reporting, and dashboard creation while learning how to convert raw data into meaningful insights. Looking forward to learning more in Excel, Power BI, and data analytics. #Excel #DataAnalytics #Dashboard #MIS #BusinessAnalytics #DataAnalysis #ExcelDashboard #PowerBI #Finance #LinkedInProjects
1
15
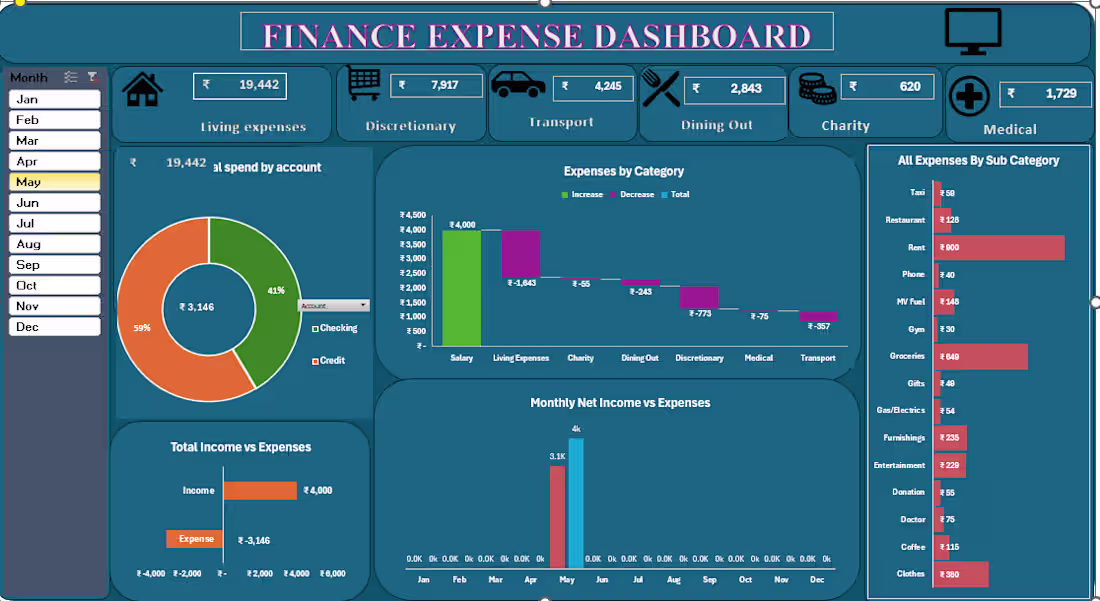
Built a finance expense dashboard using Excel to track income, expenses, and category-wise spending in a simple, visual way.
Turned raw data into clear insights like savings trends, spending patterns, and monthly breakdowns.
Always improving my Excel and data visualisation skills through real projects.
1
19
📊 Excited to share my latest Excel dashboard project!
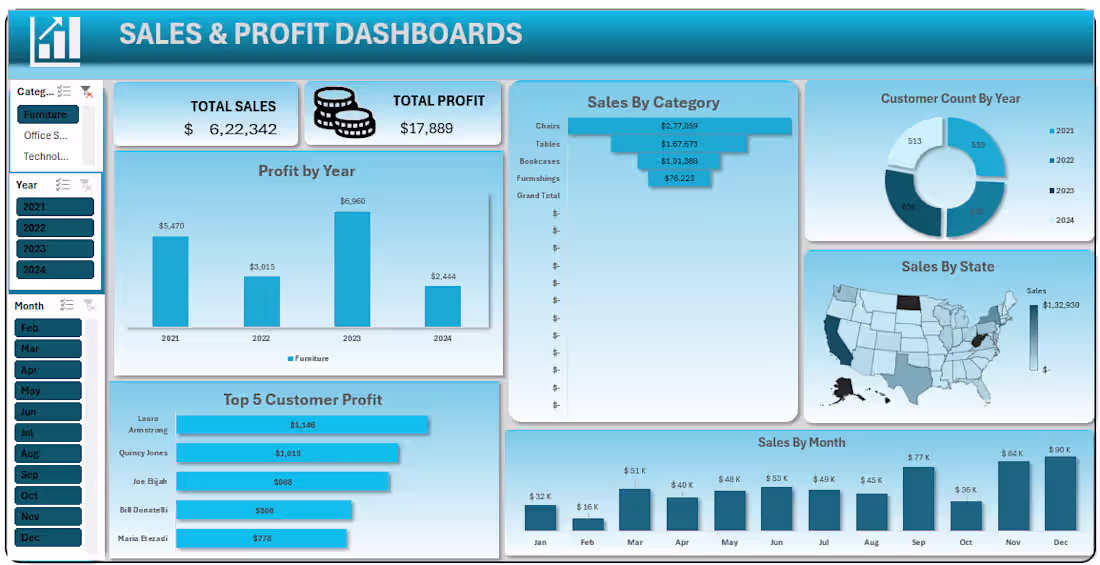
I built an e-commerce sales & profit dashboard using Microsoft Excel to analyse business performance and generate actionable insights from sales data.
🔹 Key Highlights:
• Sales & Profit Analysis
• Region-wise Performance Tracking
• Category & Sub-category Insights
• Monthly Sales Trends
• Interactive Pivot Tables & Charts
• KPI Tracking Dashboard
🛠 Tools Used:
• Microsoft Excel
• Pivot Tables
• Pivot Charts
• Data Cleaning
• Dashboard Design
📈 Through this project, I improved my skills in data analysis, business reporting, and dashboard creation while learning how to convert raw data into meaningful insights.
Looking forward to learning more in Excel, Power BI, and data analytics.
#Excel #DataAnalytics #Dashboard #MIS #BusinessAnalytics #DataAnalysis #ExcelDashboard #PowerBI #Finance #LinkedInProjects
1
54