
Vatcha Vivek Goud
Data Analyst — SQL, Excel, Power BI, Python
New to Contra
Vatcha Vivek is building their profile!
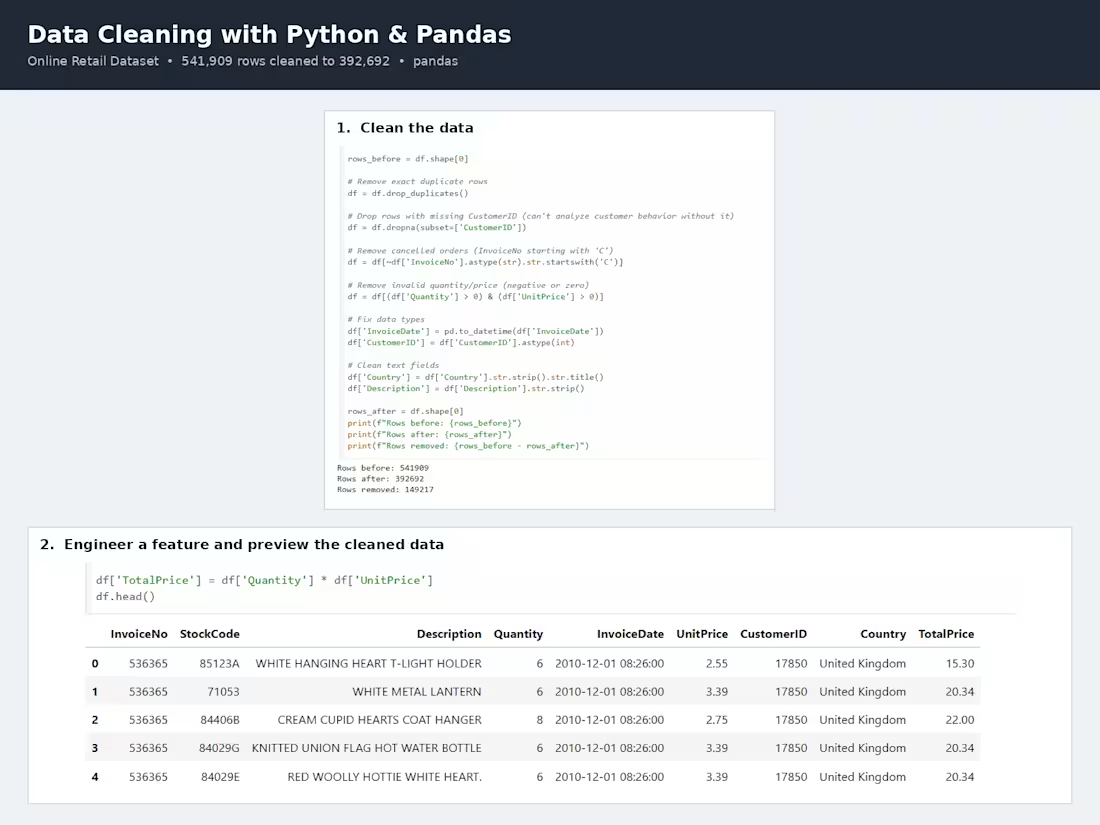
Cleaned and prepared a real-world e-commerce dataset (541,909 transaction records from the UCI Online Retail dataset) for analysis using Python and pandas. Removed exact duplicate rows, dropped records with missing Customer IDs, filtered out cancelled orders and invalid quantity/price values, corrected data types (dates, IDs), and standardized text fields like country and product description. The cleaning process reduced the dataset from 541,909 to 392,692 valid rows. Also engineered a new Total Price feature (Quantity × Unit Price) to prepare the data for downstream sales analysis and reporting. Full code, sample cleaned data, and documentation are available on GitHub.
0
14
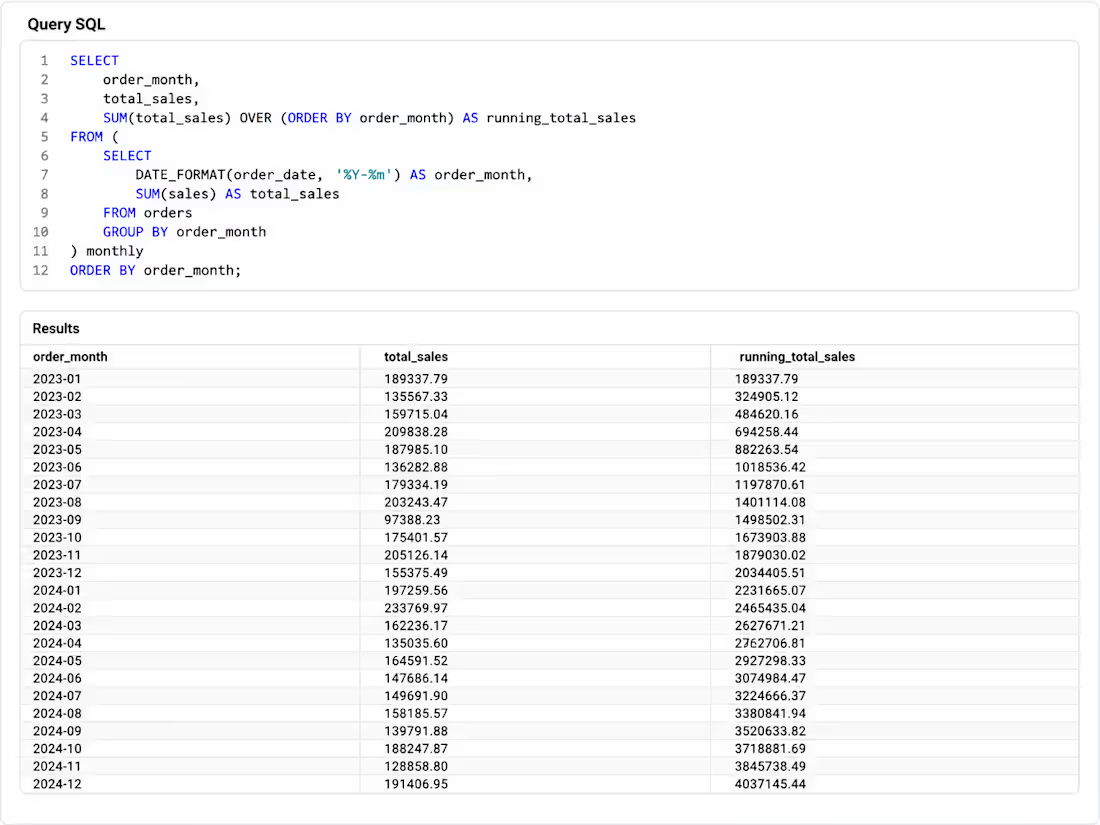
Analyzed 2 years of e-commerce order data using SQL, writing queries with window functions to uncover sales trends over time. This query aggregates monthly sales and calculates a running total using SUM() OVER (ORDER BY), showing cumulative revenue growth from $189K in Jan 2023 to $4.04M by Dec 2024. Part of a broader set of 12+ analytical queries covering top products, category performance, regional breakdowns, and order-level profitability — built to answer real business questions directly from raw transactional data.
0
18
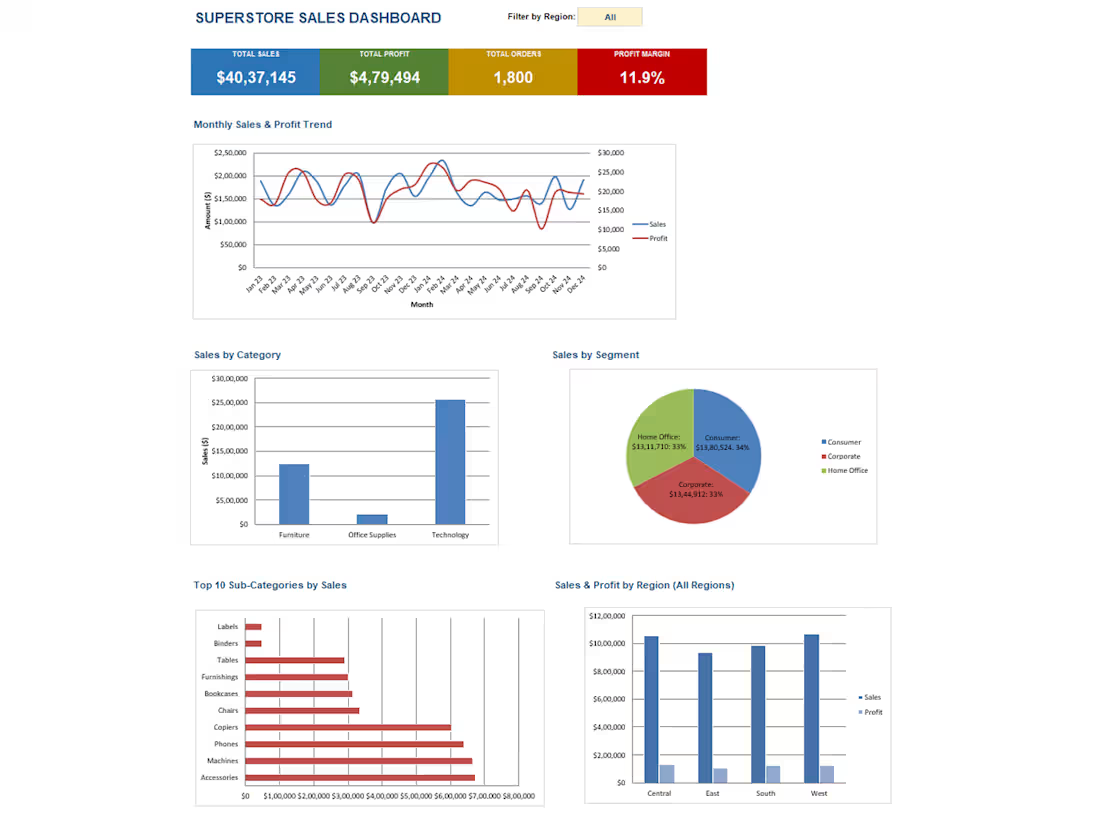
Built an interactive Excel sales dashboard analyzing Superstore-style e-commerce data. Tracked $40.37L in total sales, $4.79L in profit, 1,800 orders, and an 11.9% profit margin through KPI cards, a monthly sales-and-profit trend chart, category and segment breakdowns, top-10 sub-category rankings, and a region-wise sales & profit comparison. Built to give stakeholders a clear, filterable view of performance across products and regions.
0
24
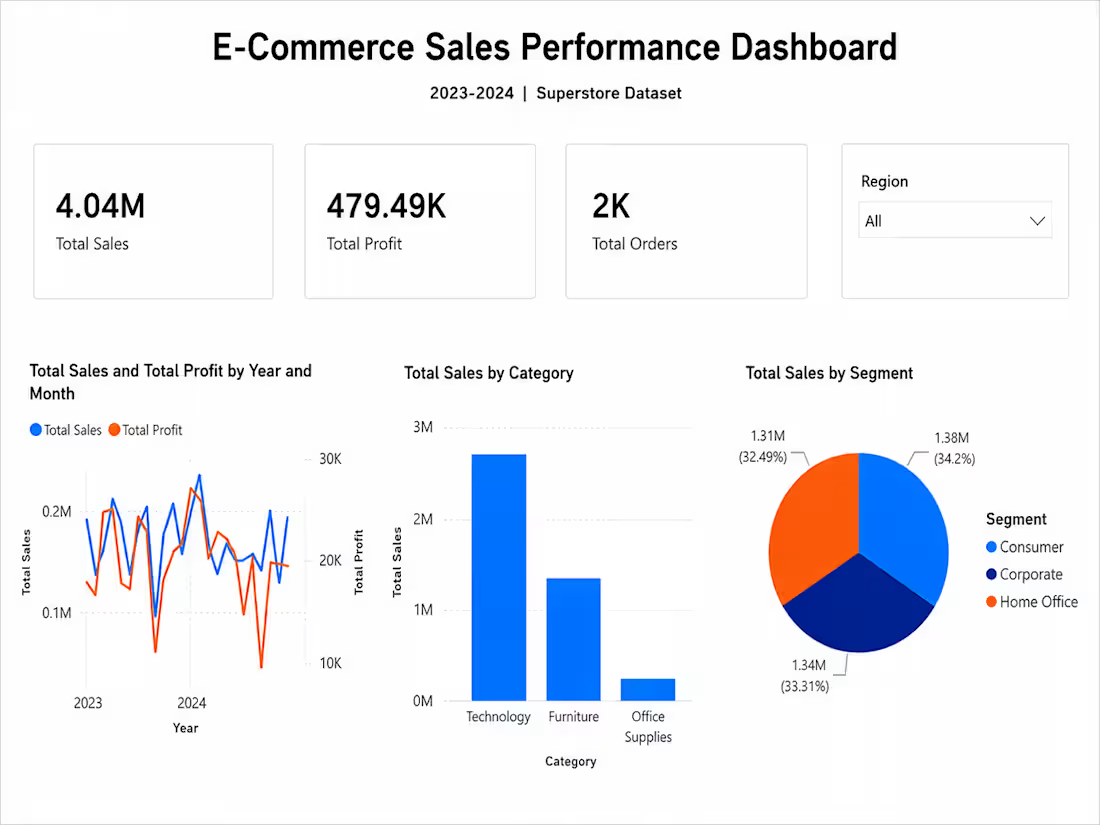
Designed an interactive Power BI sales dashboard analyzing 2 years of e-commerce performance data. Surfaced key metrics — $4.04M in total sales, $479K in profit, and 2K orders — through clean KPI cards, a monthly sales-and-profit trend line, category and segment breakdowns, and a dynamic region filter. Built to help stakeholders spot trends and make faster, data-backed decisions at a glance.
1
42