
Retail Sales Data Analysis — SQL
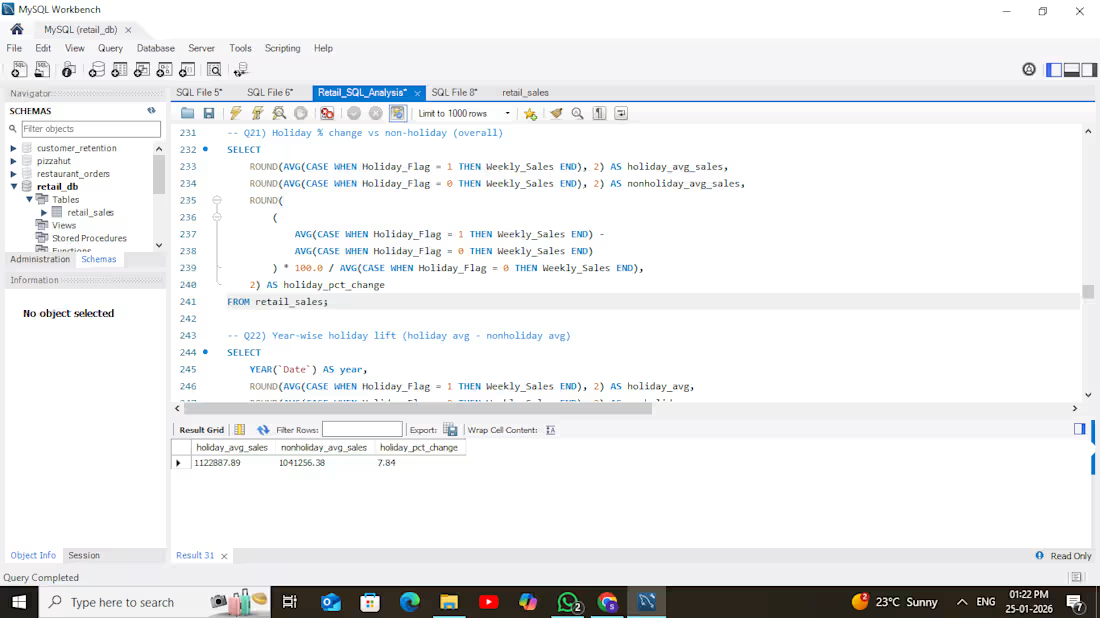
A SQL-based data analysis project focused on exploring retail sales data and extracting meaningful business insights from transactional records.
Key areas covered:
• Data exploration and preparation
• Sales and revenue analysis
• Product and category performance
• Customer and transaction analysis
• Aggregation using GROUP BY and HAVING
• Filtering and conditional analysis using WHERE and CASE WHEN
• JOINs and subqueries
• CTEs for structured analysis
• Window functions for ranking and comparative analysis
The project demonstrates how SQL can be used to transform transactional data into meaningful insights and answer practical business questions.
1
20
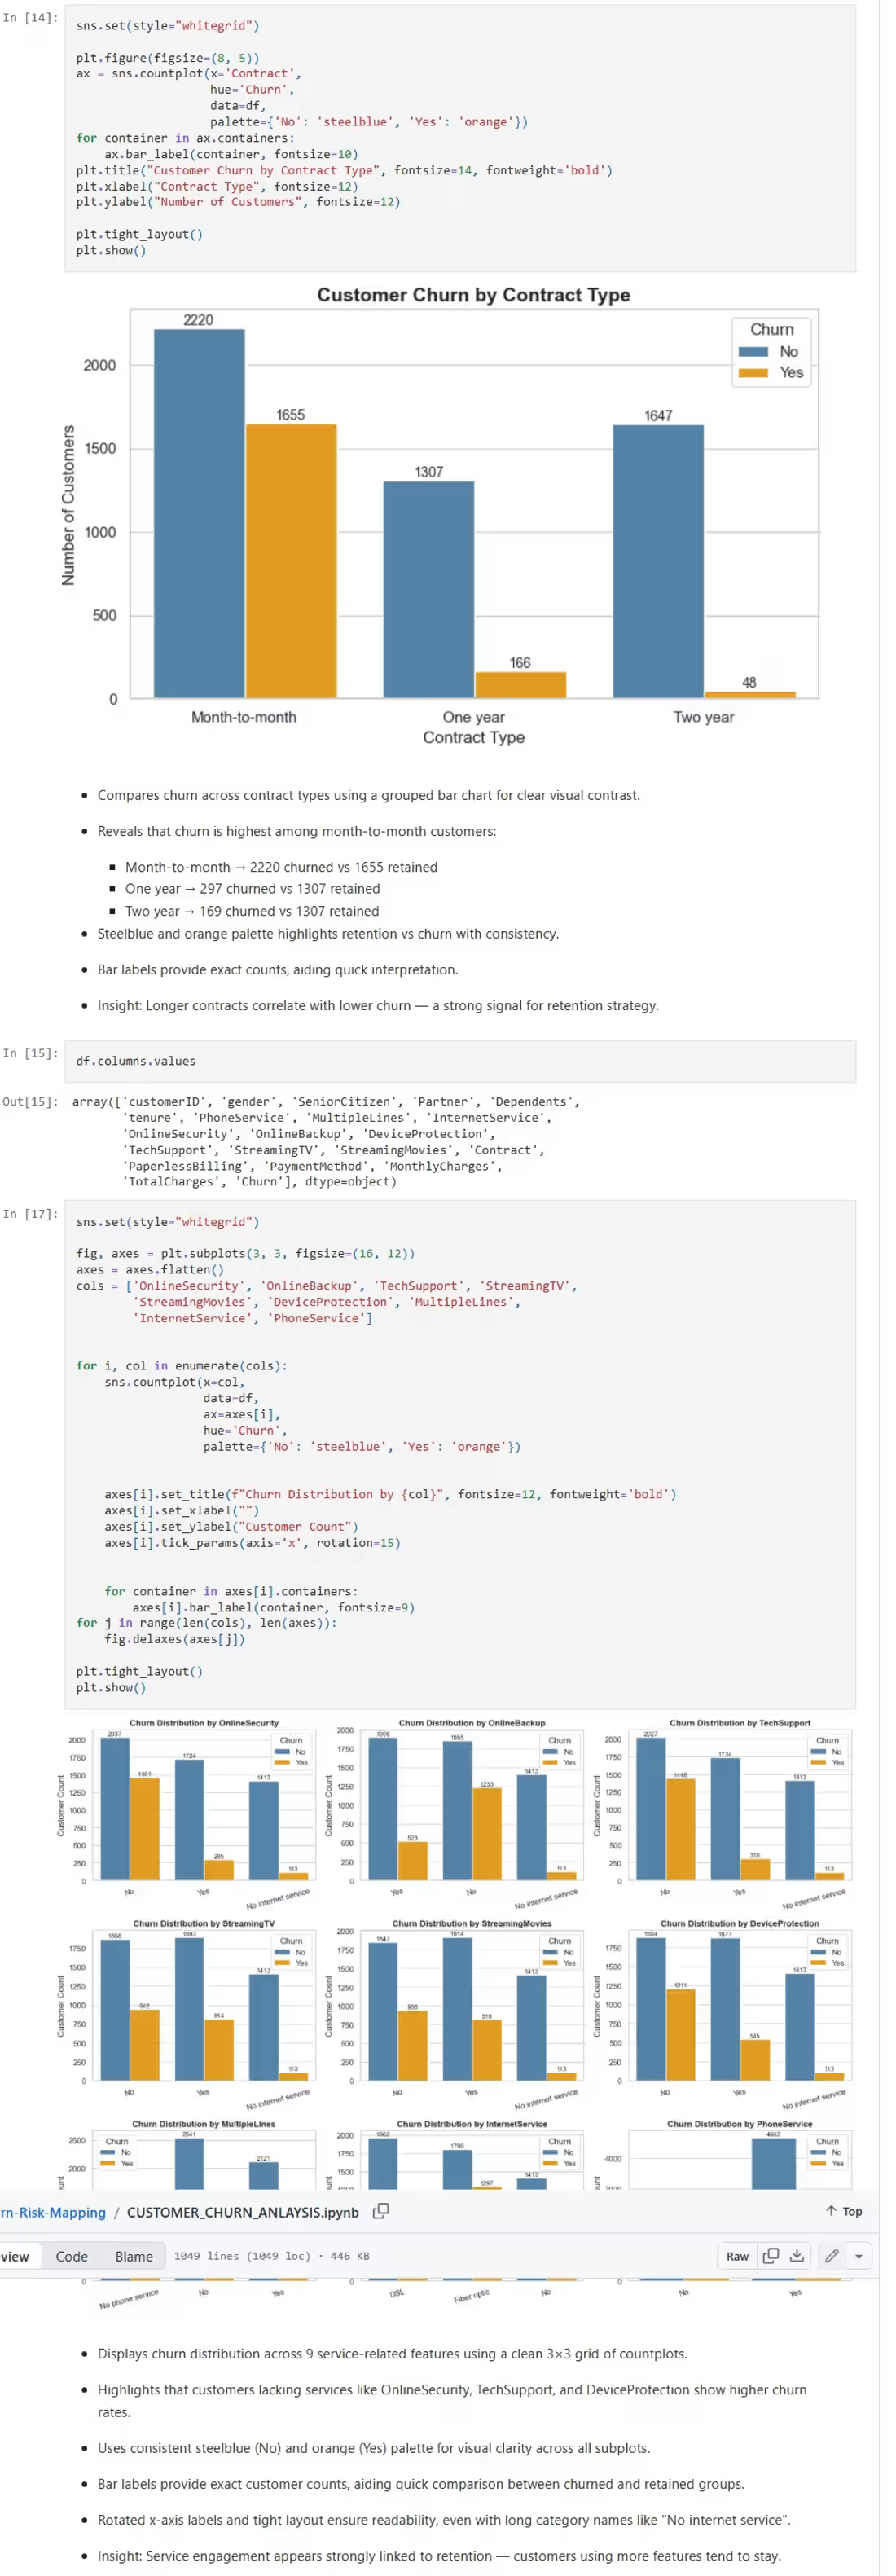
A Python-based data analysis project focused on identifying customer churn patterns and understanding the factors associated with customer attrition.
Key areas covered:
• Data cleaning and preprocessing using Pandas
• Exploratory Data Analysis (EDA)
• Churn distribution and customer segmentation
• Analysis of customer behavior and key patterns
• Data visualization using Matplotlib and Seaborn
• Identification of factors associated with higher churn risk
• Business-focused insights from customer data
The project demonstrates how Python and data analysis techniques can be used to explore customer behavior and generate actionable insights for retention-focused decision-making.
1
27
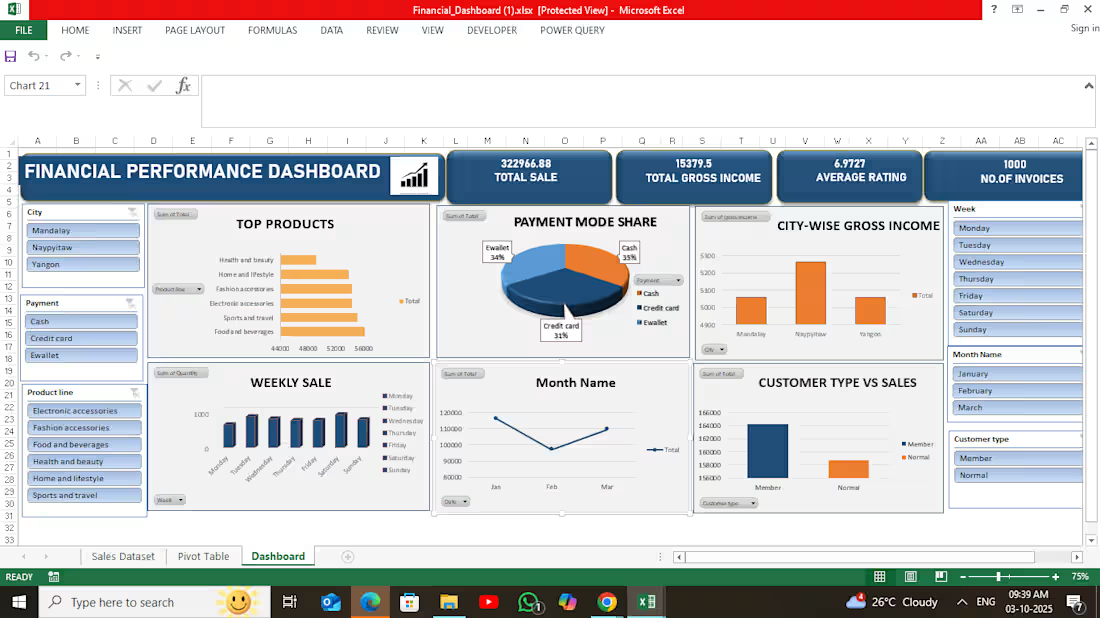
Financial Analysis Dashboard in Excel
An Excel-based financial analysis project focused on organizing, analyzing, and visualizing financial data to identify important trends and performance patterns.
Key areas covered:
• Data cleaning and organization
• Financial calculations and analysis
• KPI and performance analysis
• Pivot Tables for summarization
• Charts and visualizations
• Trend and comparison analysis
• Interactive Excel reporting
The project demonstrates how Excel can be used to transform raw financial data into a clear and structured report for better business understanding and decision-making.
1
35
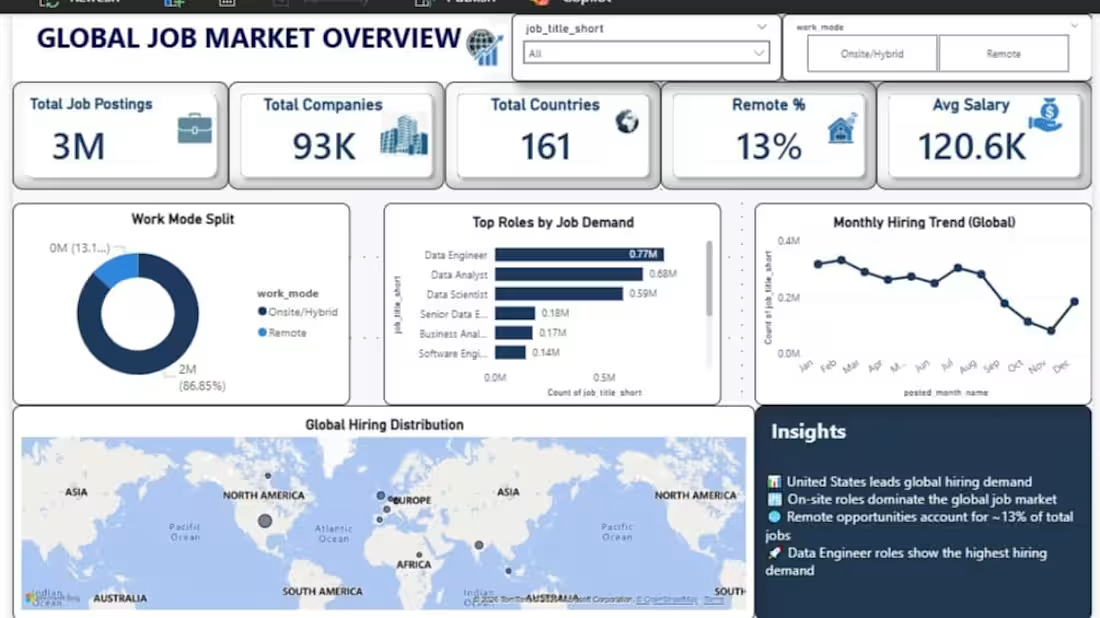
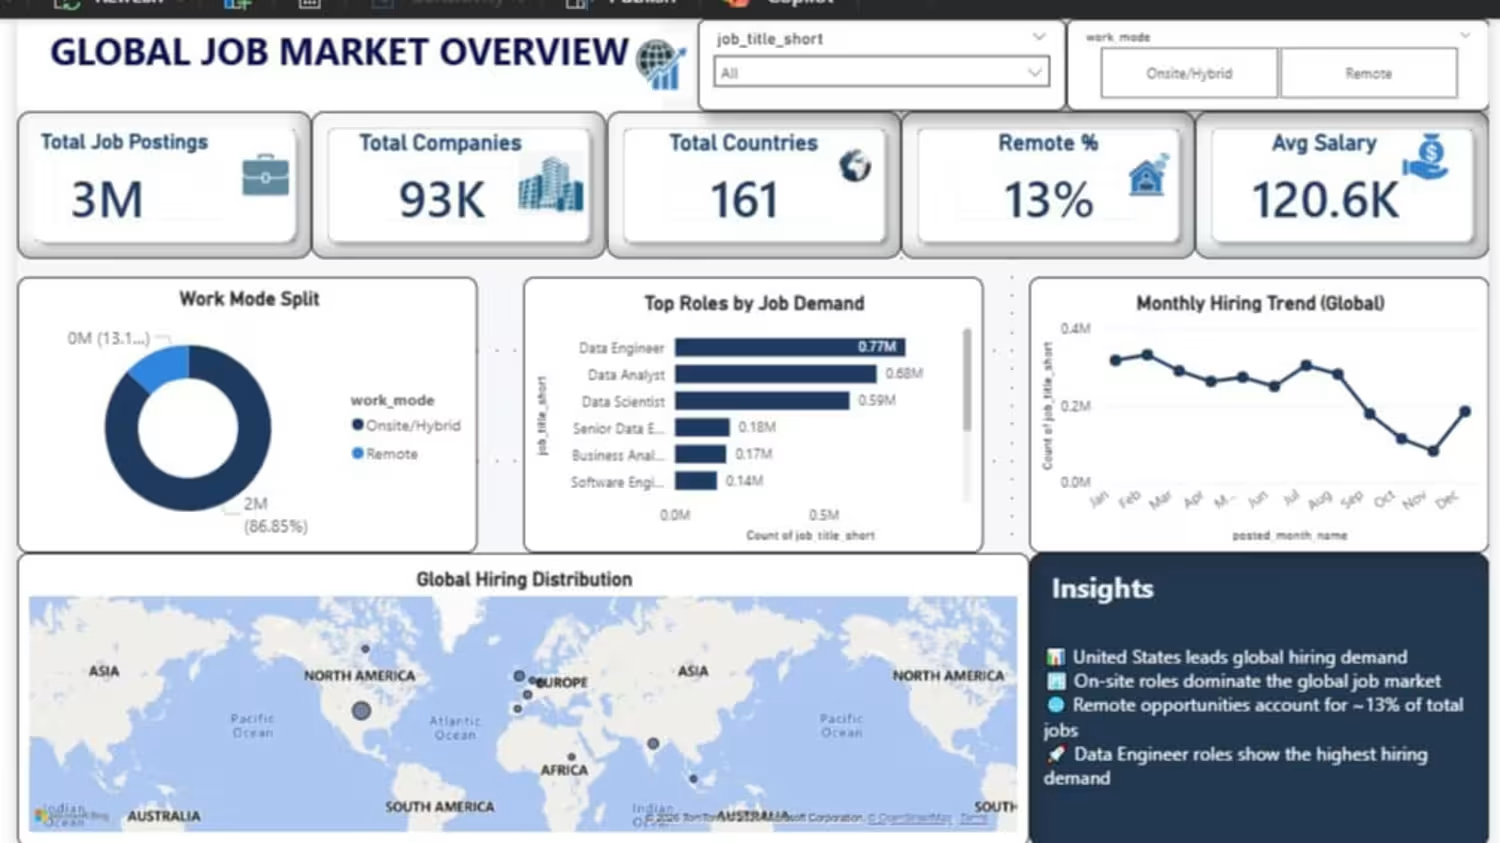
I analyzed 3M+ job postings across 161 countries and 93K companies to identify hiring trends, in-demand roles, work-mode patterns, and salary insights.
I used Python for data cleaning and preprocessing, SQL for analysis, and Power BI to build an interactive dashboard.
Key areas analyzed:
• Global hiring demand
• Top job roles by demand
• Remote vs. onsite/hybrid work patterns
• Average salary trends
• Monthly hiring trends
This project helped me turn a large dataset into clear, actionable insights for understanding the global job market.
2
45