
Christians Steven Zoe
Data Scientist | Solving Business Problems with Data & ML
Ready for work
Christians Steven is ready for their next project!

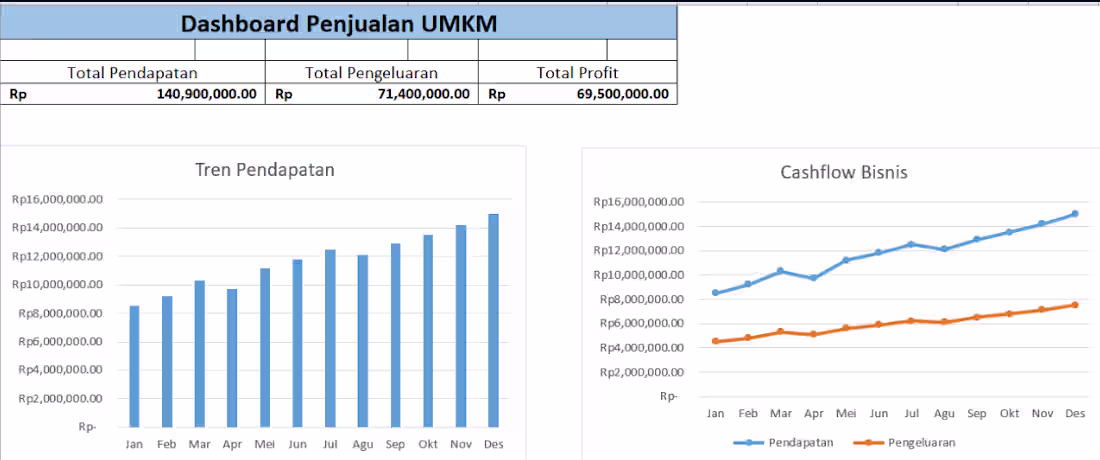
# 📊 Dashboard for Small Businesses (UMKM)
A simple and user-friendly Excel dashboard designed to help small business owners monitor their business performance and make better decisions through data.
---
## 🚀 Project Overview
This project demonstrates how sales data can be transformed into meaningful business insights using Microsoft Excel.
The dashboard provides a clear overview of:
- Monthly revenue
- Monthly expenses
- Profit tracking
- Cashflow trends
- Business performance visualization
---
## ✨ Features
✅ Sales Dashboard
✅ Cashflow Monitoring
✅ Profit & Loss Summary
✅ Interactive Charts
✅ Clean and Easy-to-Understand Layout
## 📸 Dashboard Preview
Dashboard screenshots are available in the `screenshots` folder.
---
## 🛠 Tools Used
- Microsoft Excel
- Google Sheets
- Git & GitHub
---
## 💡 Business Value
Small business owners often struggle to understand their financial performance because their data is scattered and difficult to interpret.
This dashboard simplifies business reporting and helps users:
- Track revenue growth
- Monitor expenses
- Identify profit trends
- Make data-driven decisions
---
## 👨💻 Created By
Christians Steven Zoe
Aspiring Data Analyst & Freelance Data Specialist
GitHub:
https://github.com/stevendsml01-blockchain
1
28
Data Cleaning and Sales Analysis
## Project Overview
This project demonstrates an end-to-end data cleaning and exploratory data analysis (EDA) workflow using Python.
The dataset was intentionally generated with multiple data quality issues to simulate real-world business scenarios commonly encountered by Data Analysts and Data Scientists.
---
## Objectives
- Identify data quality issues.
- Handle missing values.
- Remove duplicate records.
- Standardize mixed date formats.
- Perform exploratory data analysis.
- Generate business insights.
- Create visualizations for decision-making.
---
## Dataset Issues
The raw dataset contained several intentional problems:
- Missing values in `Qty`
- Missing values in `Harga`
- Duplicate transactions
- Mixed date formats
- Inconsistent category naming
---
## Data Cleaning Process
The following steps were performed:
1. Loaded and profiled the raw dataset.
2. Identified missing values and duplicate records.
3. Removed duplicate transactions.
4. Filled missing values using median imputation.
5. Investigated mixed date formats.
6. Built a custom date parser to standardize dates.
7. Saved the cleaned dataset.
---
## Results
### Before Cleaning
| Metric | Value |
|----------|---------|
| Total Records | 1009 |
| Missing Qty | 8 |
| Missing Harga | 5 |
| Duplicate Records | 10 |
# After Cleaning
| Metric | Value |
|----------|---------|
| Total Records | 999 |
| Missing Qty | 0 |
| Missing Harga | 0 |
| Duplicate Records | 0 |
| Failed Date Parsing | 0 |
---
## Business Insights
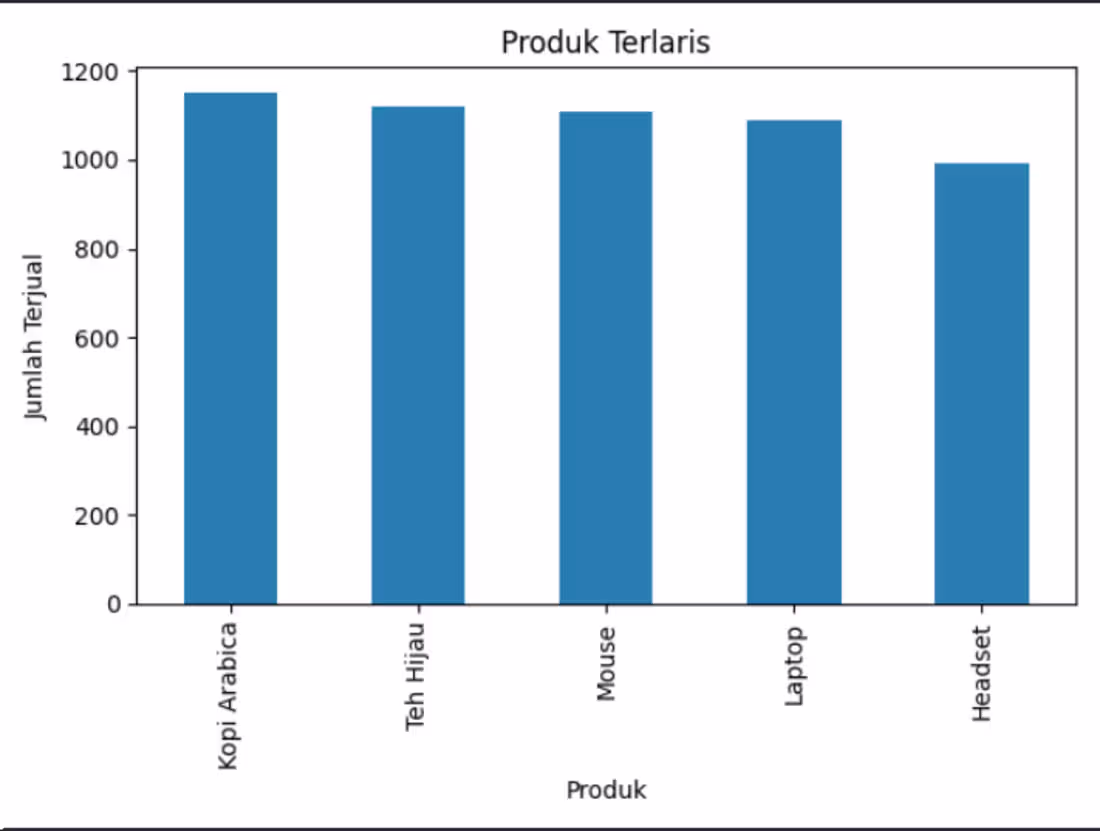
### Best-Selling Products
Kopi Arabica was the top-selling product, followed by Teh Hijau and Mouse.
### Sales by City
Bandung generated the highest sales volume, indicating strong market potential compared to Surabaya and Jakarta.
### Category Performance
Electronics dominated sales performance.
An inconsistency between `Makanan` and `makanan` was discovered, highlighting the importance of data standardization before analysis.
### Revenue
The total revenue generated was:
Rp 13,593,130,000
## Technologies Used
- Python
- Pandas
- NumPy
- Matplotlib
1
28
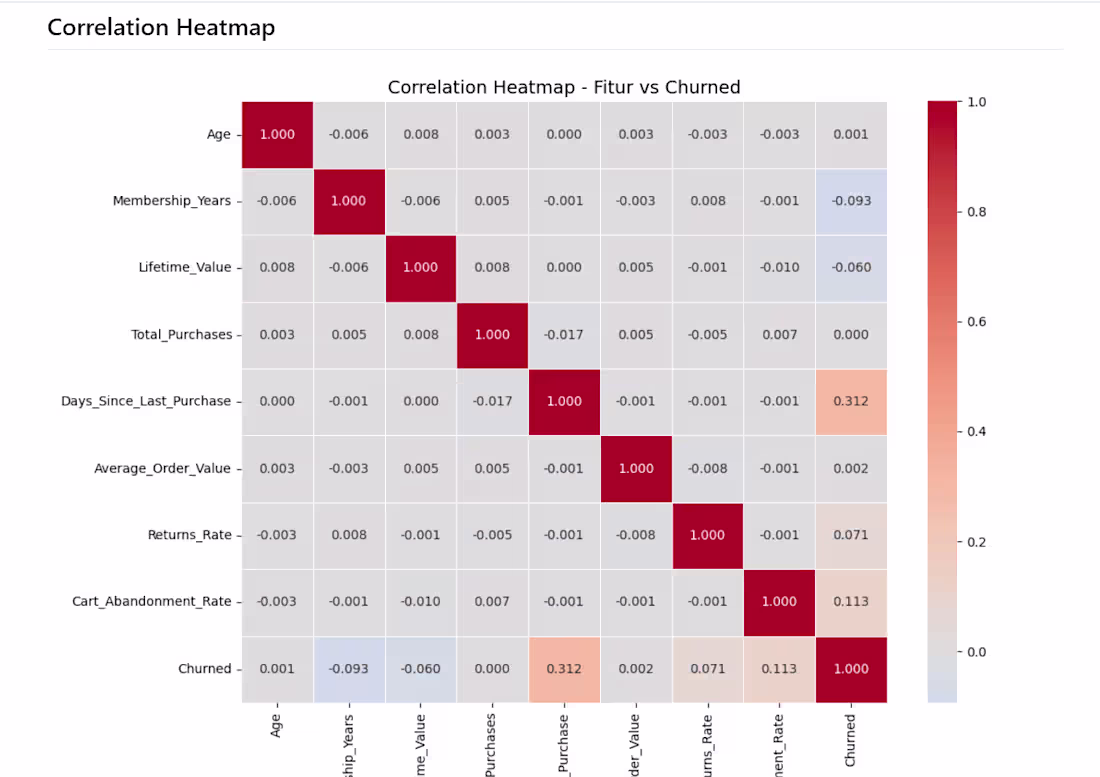
Image 1 – Project Overview & Dataset Information
Customer Churn Prediction Using Random Forest
This project focuses on predicting customer churn using machine learning techniques to help businesses proactively identify customers who are likely to discontinue their services.
The predictive solution was developed using a structured approach involving Random Forest classification, SMOTE oversampling for handling class imbalance, GridSearchCV for hyperparameter optimization, and threshold tuning to improve recall performance.
The dataset contains customer demographic and behavioral attributes, including:
Age, Membership Years, Lifetime Value, Total Purchases, Days Since Last Purchase, Average Order Value, Returns Rate, Cart Abandonment Rate
The target variable is customer churn status, where:
0 = Active Customer, 1 = Churned Customer
Business Objective: The primary objective of this project is to identify customers at risk of churn so businesses can implement preventive retention strategies and reduce customer attrition.
Image 2 – Machine Learning Pipeline
End-to-End Machine Learning Workflow:
A comprehensive machine learning pipeline was designed to ensure robustness, reproducibility, and business relevance throughout the modeling process.
The workflow consisted of:
1. Data Cleaning
Prepared and validated the dataset by handling inconsistencies and ensuring data quality.
2. Exploratory Data Analysis (EDA)
Investigated customer behavior patterns and feature distributions to understand underlying trends.
3. Baseline Random Forest Modeling
Established an initial benchmark using Random Forest classification.
4. SMOTE Oversampling
Addressed class imbalance to improve the model's ability to detect churned customers.
5. Hyperparameter Tuning
Optimized model performance using GridSearchCV.
6. Threshold Tuning
Adjusted classification thresholds to maximize business-oriented objectives, particularly recall.
7. Model Evaluation
Assessed predictive performance using multiple evaluation metrics.
Professional Value
This structured workflow demonstrates adherence to industry best practices rather than relying solely on default machine learning configurations.
Image 3 – Correlation Heatmap
Exploratory Correlation Analysis
A correlation heatmap was generated to identify relationships between customer attributes and churn behavior.
The analysis revealed several noteworthy insights:
Customers with longer periods since their last purchase exhibited a stronger tendency to churn.
Higher cart abandonment rates were moderately associated with increased churn risk. Demographic variables such as age showed minimal correlation with churn outcomes.
Key Insight
The strongest relationship with churn was observed in:
Days Since Last Purchase (correlation = 0.312)
suggesting that customer inactivity is a meaningful indicator of potential attrition.
Business Relevance
Understanding these relationships enables organizations to focus their retention initiatives on the factors most strongly associated with customer loss.
Image 4 – Key Insights, Recommendations & Technologies Used
Key Insights
Several actionable findings emerged from the analysis:
1. Customers with extended inactivity periods are more likely to churn.
2. Elevated cart abandonment behavior may signal disengagement.
3. Improving recall is critical because accurately identifying potential churners aligns directly with the business objective.
Business Recommendations:
Based on the findings, the following strategies are recommended:
Target High-Risk Customers:
Deploy retention campaigns aimed at customers identified as likely to churn.
Personalize Customer Communication:
Develop personalized email and promotional initiatives to improve engagement.
Strengthen Loyalty Programs:
Offer incentives and rewards to reactivate inactive customers.
Monitor Behavioral Indicators:
Continuously track customer activity metrics to detect early warning signs of churn.
Technologies Used
The project was implemented using the following technologies:
Python
Pandas
NumPy
Matplotlib
Seaborn
Scikit-Learn
Imbalanced-Learn
1
63
The reports folder contains model evaluation outputs generated during the machine learning workflow. These reports provide insights into model performance, feature importance, and predictive capabilities, helping stakeholders understand both the effectiveness and business implications of the solution.
1. Feature Importance Report
Feature importance analysis was performed to identify the variables that contributed most to customer churn predictions, providing valuable to business insights.
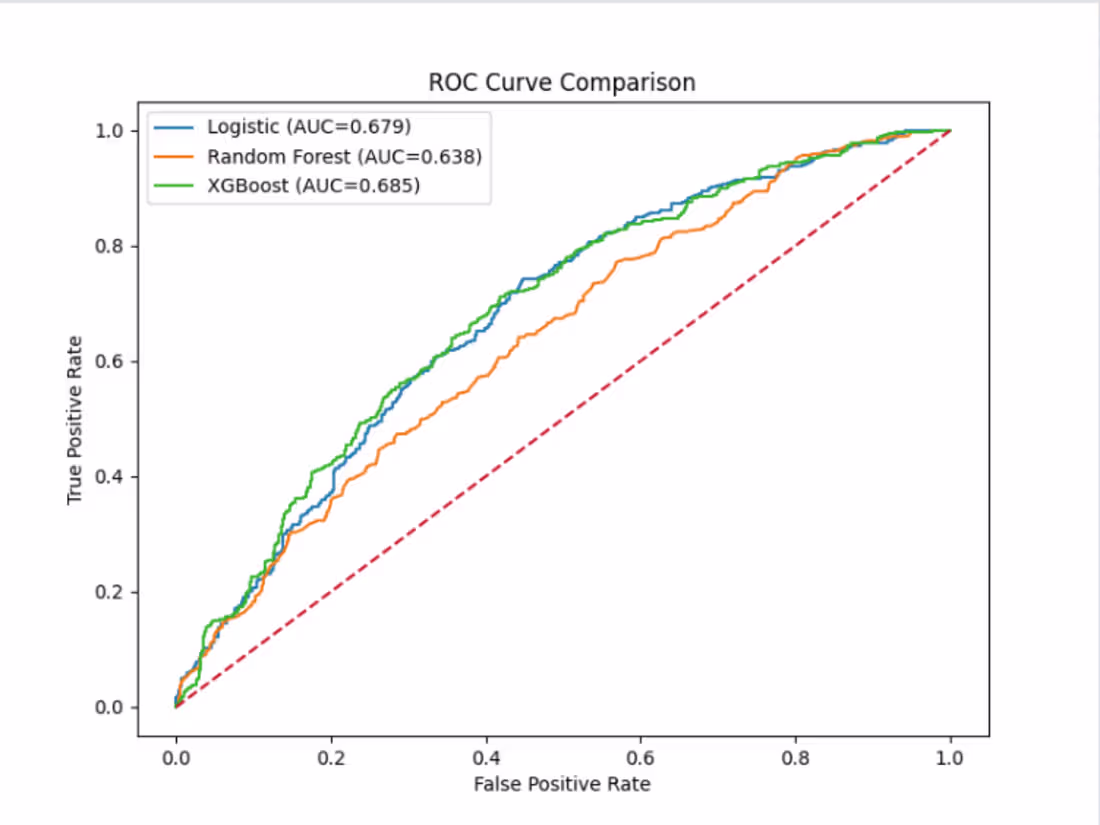
2. ROC Curve Report
ROC-AUC analysis was used to compare multiple machine learning models and identify the model with the strongest predictive performance.
3. Confusion Matrix Report
A confusion matrix was generated to evaluate classification outcomes and understand the strengths and limitations of the predictive model.
1
84