
Sohaib Akram
Finance & Data Analyst | Excel & Power BI Dashboards
New to Contra
Sohaib is ready for their next project!

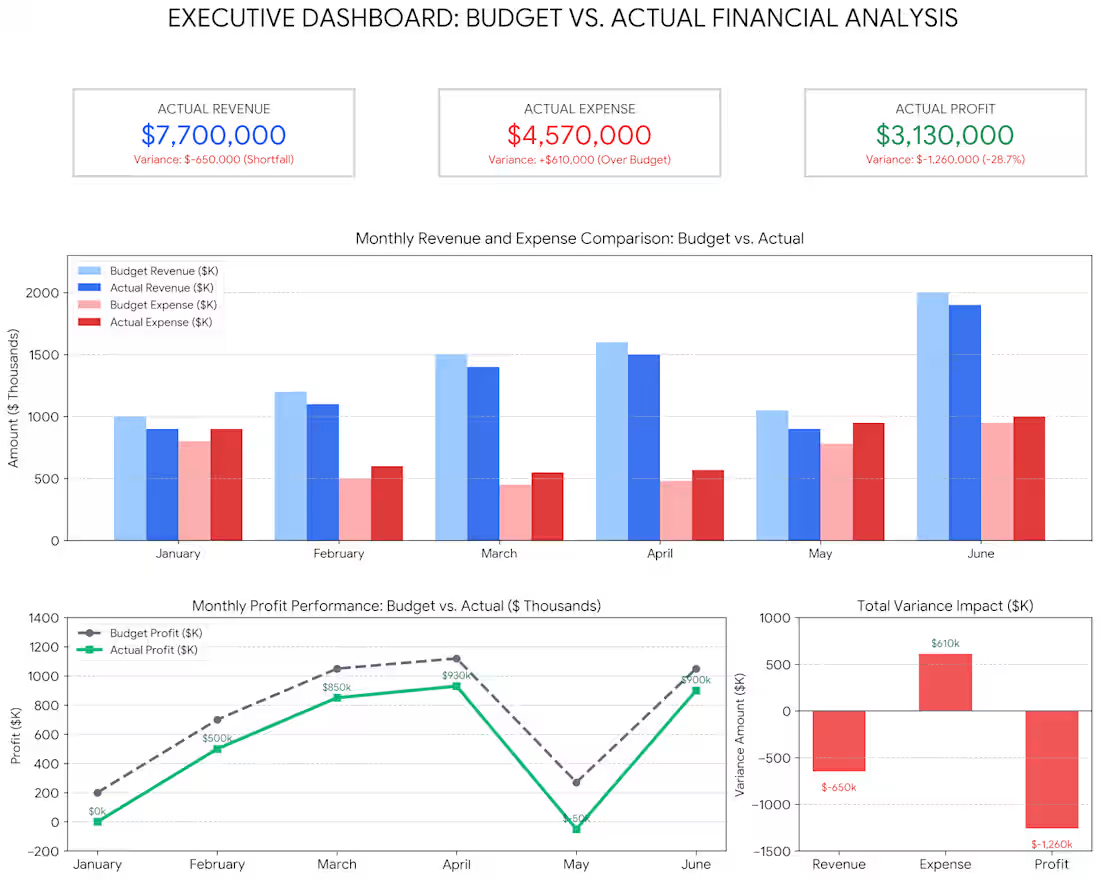
(Budget Analysis & Variance Dashboard) is a financial performance tracking model designed to evaluate an organization's operational results against targeted financial goals across a 6-month period (January–June). The project assesses revenue targets, cost controls, net profit margins, and budget variances to pinpoint financial inefficiencies and operational overruns.
Key Outcomes & Achievements
Revenue Shortfall Assessment: Tracked actual top-line revenue ($7,700,000) against projected targets ($8,350,000), identifying an overall revenue deficit of -$650,000 (-7.8% under budget).
Expense Overrun Identification: Analyzed cost structures to reveal total actual expenses of $4,570,000 against a budgeted cap of $3,960,000, identifying an adverse expense overrun of +$610,000 (+15.4% over budget).
Bottom-Line Profit Variance Modeling: Measured total net profit contraction. Due to combined top-line underperformance and cost inflation, total actual profit was $3,130,000 versus a projected $4,390,000, representing a -$1,260,000 (-28.7%) unfavorable variance.
Monthly Deficit Pinpointing: Highlighted May as the worst-performing operating period, where actual revenue fell -$150,000 short and actual expenses ballooned by +$170,000, producing a net monthly operating loss of -$50,000 against a budgeted profit target of $270,000.
Executive Visualization Engineering: Built a 4-panel financial dashboard with real-time KPI variance metrics, dual-series bar visual comparisons, line overlays for profit targets, and net impact variance indicators.
0
14
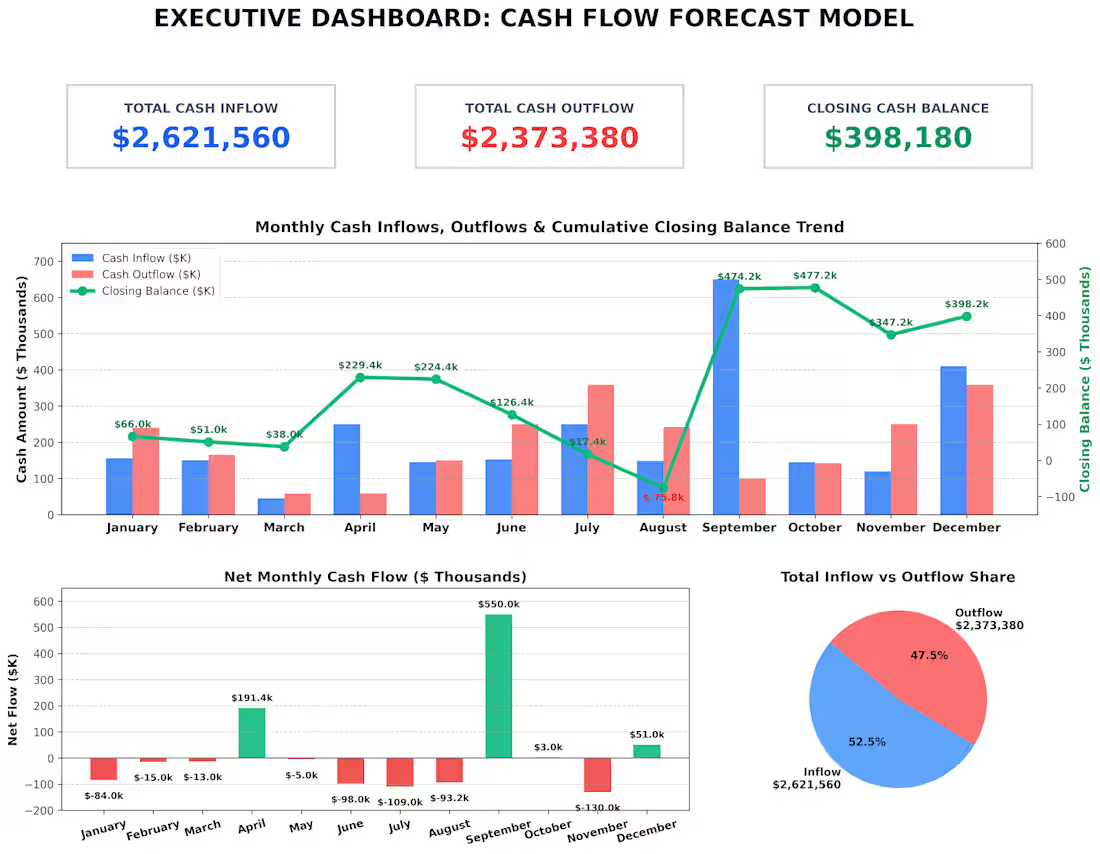
(Cash Flow Forecast Model & Executive Dashboard) is a financial liquidity and cash management reporting framework designed to evaluate an organization's monthly cash position across a 12-month operating cycle. The project transforms raw financial transaction data—comprising opening balances, cash inflows, and cash outflows—into an interactive visual dashboard.
Key Outcomes & Achievements
Liquidity & Deficit Risk Tracking: Formulated a rolling cash flow tracking model that successfully pinpointed critical cash-burn periods. The analysis identified an August deficit of -$75,820 caused by consecutive peak outflow months (July: $359,000; August: $241,780), enabling advance visibility into working capital shortfalls.
Cash Flow Variance & Recovery Modeling: Analyzed monthly net cash flow fluctuations to measure solvency recovery. Identified a +$550,000 net cash surplus in September that replenished cash reserves and restored liquidity to $474,180.
Annual Solvency Performance: Conducted full-year aggregation showing $2,621,560 in total cash inflows against $2,373,380 in total outflows. This verified a positive annual net cash flow of +$248,180 and an ending cash balance of $398,180.
Executive Visualization & Reporting: Engineered a modern multi-panel dashboard incorporating dynamic KPI callouts, twin-axis trendlines for cumulative balances, and color-coded net cash flow indicators to facilitate rapid decision-making for corporate finance leadership.
Technical Tools & Methodologies Used
Data Processing & Analytics: Python for loading, auditing, and processing complex financial time-series data from Microsoft Excel
Financial Visualization Engineering: matplotlib and matplotlib.gridspec to construct custom, executive-ready dashboard layouts featuring dual-y axis overlays, grouped bar charts, and proportion visuals.
Layout Design & Quality Control: PIL (Pillow) to verify high-resolution output rendering, pixel alignment, and typography hierarchy across visual elements.
0
10
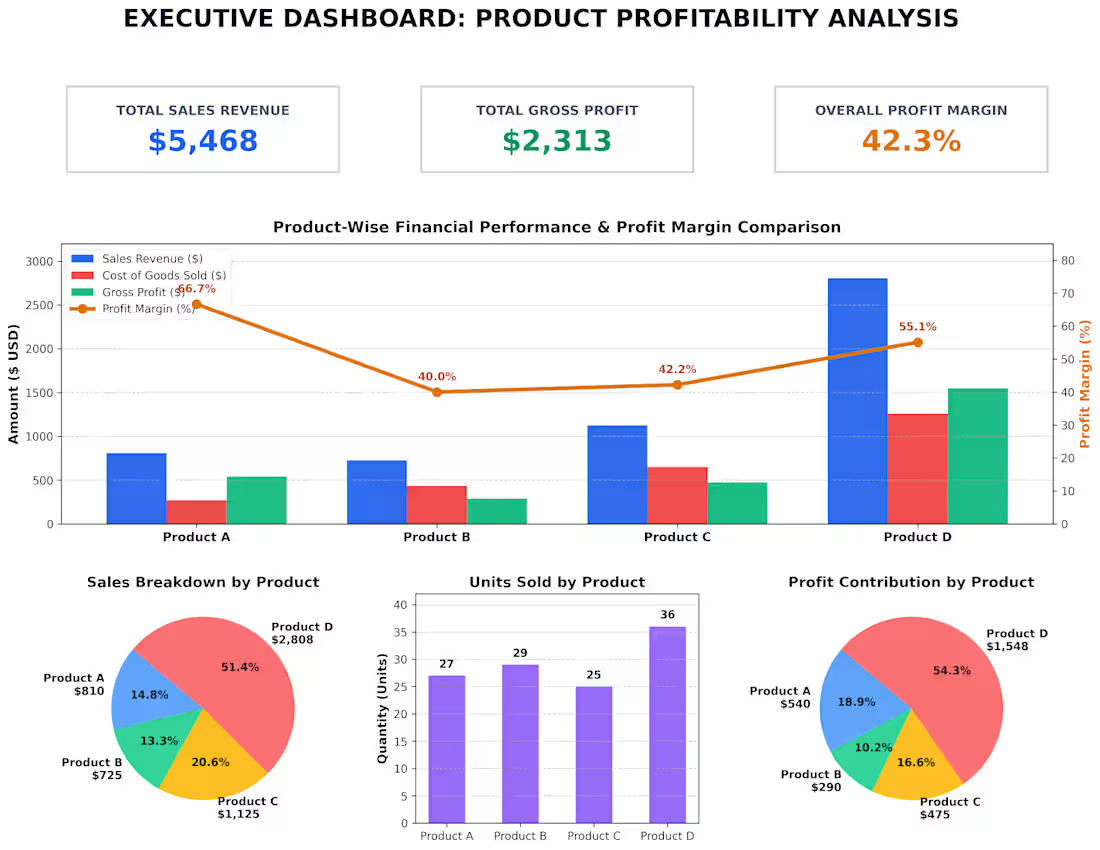
Dashboard Key Highlights:
Total Performance: Total Revenue of $5,468 and Gross Profit of $2,313 with an overall profit margin of 42.3%.
Top Profit Contributor: Product D yields the highest gross profit at $1,548 (54.3% of total profit) and revenue of $2,808 (51.4% of total sales).
Highest Margin Product: Product A leads in efficiency with a 66.7% profit margin ($540 profit on $810 sales).
1
0
58
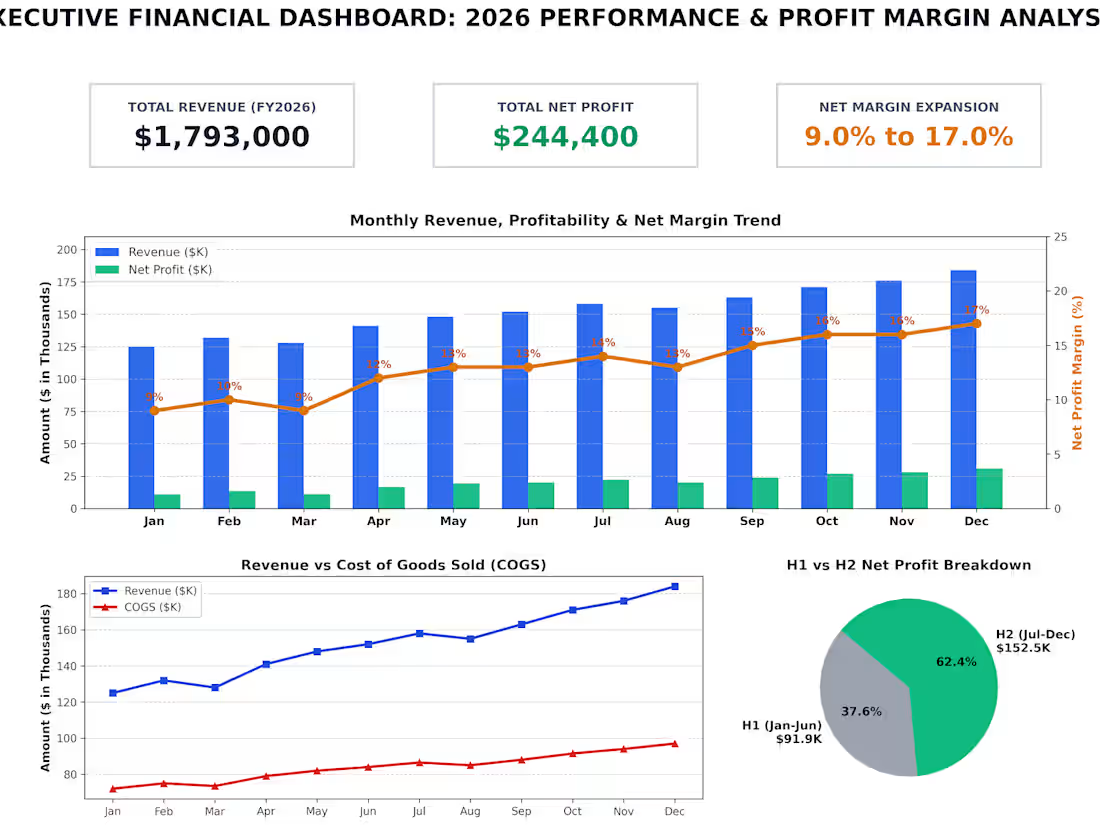
Project 1: Executive Financial Dashboard & Performance Model
Project Title: Executive Financial Dashboard & Revenue Growth Analysis
Role / Service: Financial Analyst & Dashboard Specialist
Overview
Developed a comprehensive monthly financial performance model and executive dashboard to evaluate business profitability, revenue trends, and operational expense structures.
Tools Used
Microsoft Excel (Advanced Formulas, Dynamic Summaries)
Financial Ratio Analysis Frameworks
Executive Visual Dashboards
Key Highlights & Deliverables
P&L Structure: Modeled a $1.96M annual revenue dataset to track core profitability drivers across multiple operating cycles.
Margin Expansion: Tracked net profit margin trajectory, demonstrating an operational expansion from 9% to 17%.
KPI Tracking: Built clean summary views for top-line revenue, total operating expenses, and net earnings for quick executive review.
Outcome
Transformed raw monthly figures into strategic visual insights, giving decision-makers immediate clarity on operating leverage and profit margins
0
13