
Sireesha Gandlapathi
Engineer who is into technical things
New to Contra
Sireesha is building their profile!


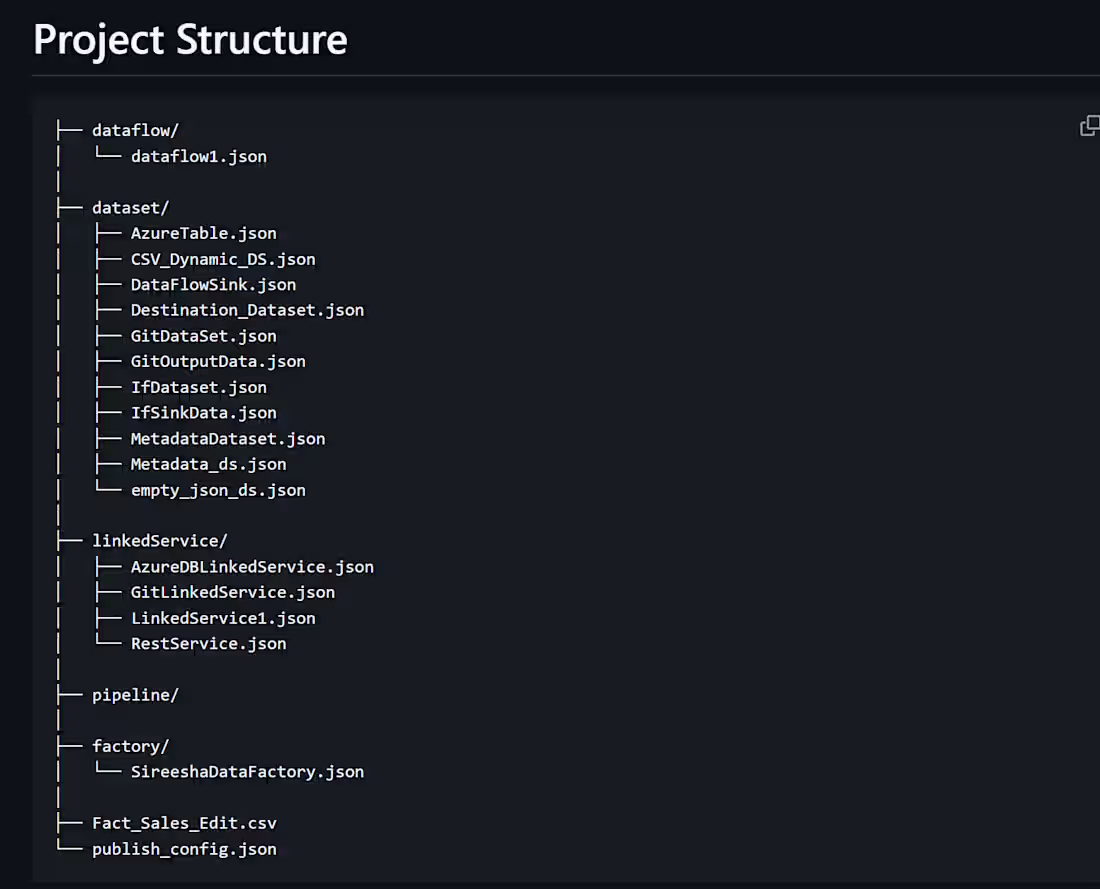
Azure Data Factory (ADF) project designed to build scalable and dynamic data pipelines. The project includes pipelines, datasets, linked services, and dataflows to enable end-to-end data ingestion, transformation, and loading.
Following are the steps done in this project -
Created the storage group in resource group and uploaded the files
Then, created the pipeline to load the data from source to destination.
In creation of pipeline, I used the linked services as connection to load the data. Created linked services as mentioned for CSV Files, Azure tables, github.
Load the data from github, and get metadata for all the files present in container and applied transformations using pipeline activites, and used CDC for incremental loading. And used the storage based triggers, to run the piepline if there is any new data activity.
And finally added the destination to load output and created alerts using Logic Apps to get mail if pipeline fails.
Firstly we load the data, and update CDC accordingly, and if there are any rows in the table, trigger will start and pipeline will run.
My Work Link: https://github.com/siri70931/AzureDataFactory
0
19
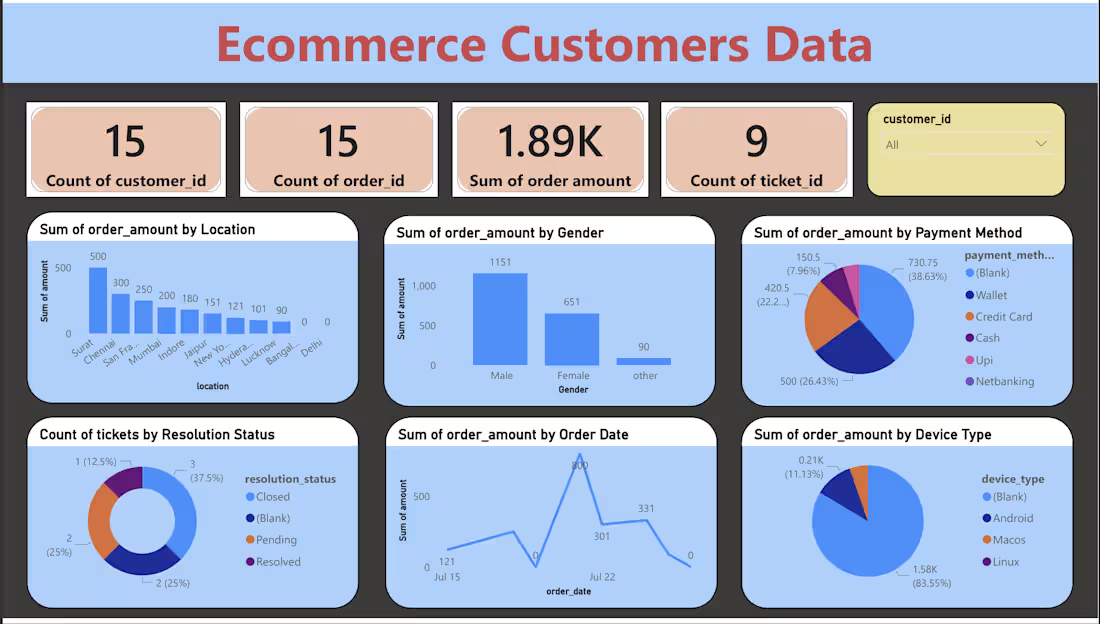
Designed and implemented an end-to-end data analytics solution using Microsoft Fabric to transform raw e-commerce data into actionable business insights.
Built an end-to-end data analytics solution using Microsoft Fabric following the Medallion Architecture (Bronze, Silver, Gold layers) to transform raw e-commerce data into high-quality, business-ready insights.
Process: Raw Data → Bronze Layer → Silver Layer → Gold Layer → Semantic Model → Power BI Dashboard
Architecture Overview
Data Source → Data Pipeline → Lakehouse → Notebook Transformations → Semantic Model → Power BI Report
Key Components -
Data Pipeline: Handles ingestion and orchestration of data workflows Lakehouse: Central storage for raw and transformed datasets Notebooks: Data cleaning, transformation, and enrichment Semantic Model: Optimized data model for reporting and analytics Power BI Report: Interactive dashboard for business insights
My work link: https://github.com/siri70931/Azure_DataEngineering_Fabric_Project
0
22
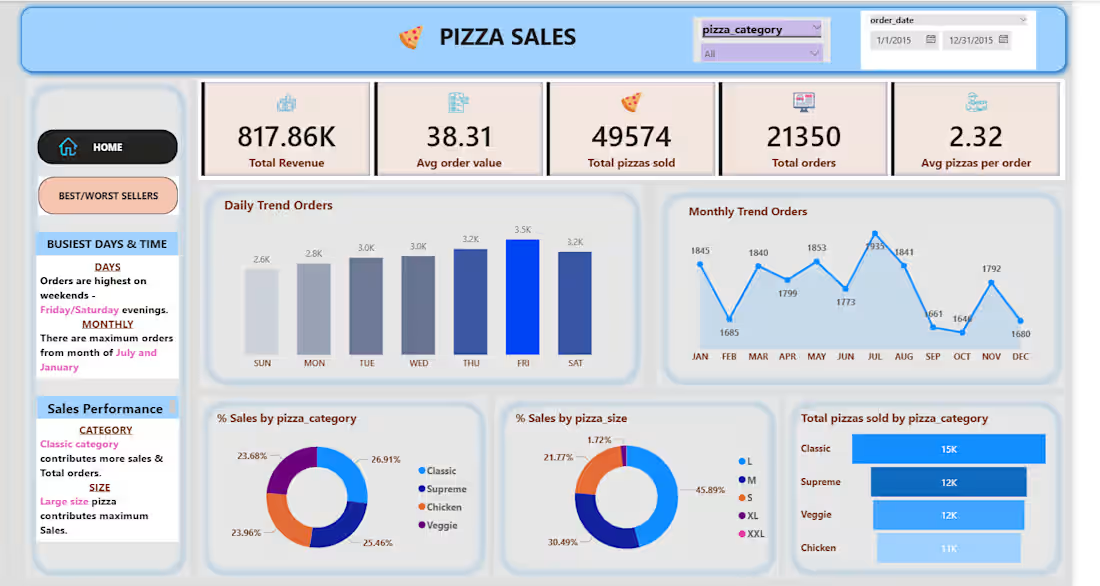
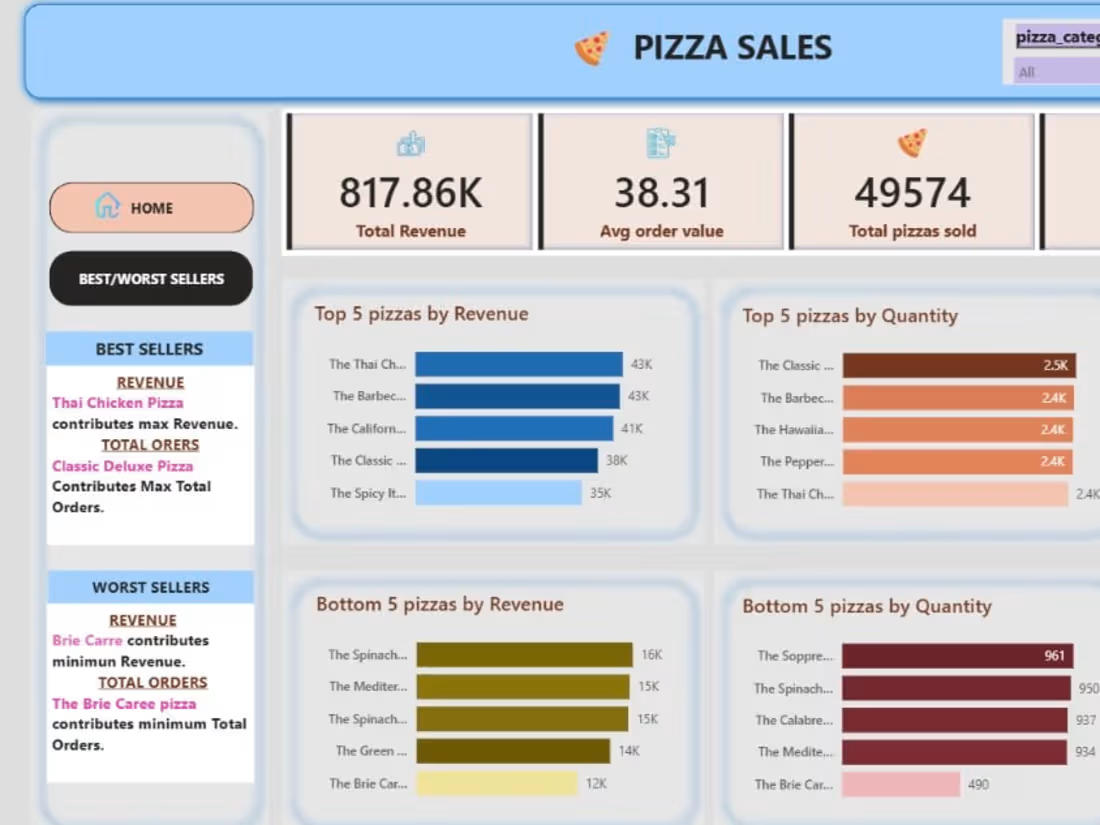
I created Dashboard for Pizza sales, to determine total orders placed, Revenue generated by pizza category, what kind of Pizza contributing more to the Revenue, percentage of sales by pizza category, sales by pizza size, best and worst performers by involving KPI's, graphs, DAX Functions, Power Query Editor and other features of Power BI.
0
52
I am currently working on Data cleaning, Data Visualization, Data Handling, Data pipelines and everything related to data.
please check my work on github : https://github/siri70931
0
53