
Shehban Ali
Data Analyst specializing in risk reporting systems
New to Contra
Shehban is ready for their next project!
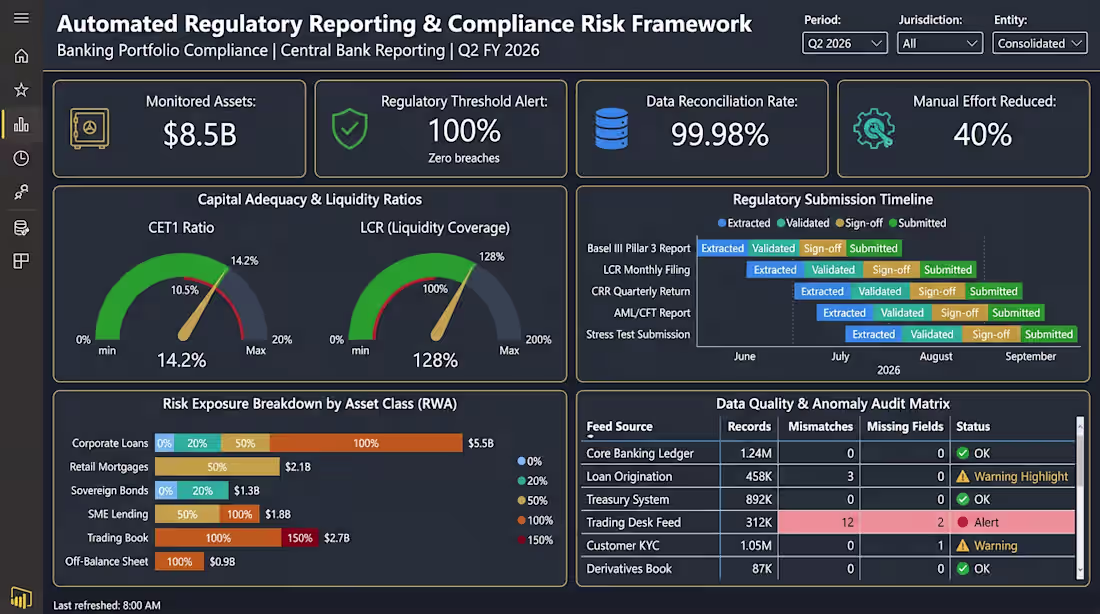
Engineered an enterprise-level regulatory reporting dashboard in Power BI to automate monthly and quarterly compliance tracking for a major banking portfolio. Built robust ETL pipelines to consolidate disparate transaction data, ensuring strict adherence to central bank risk thresholds and liquidity mandates. Implemented automated data-lineage validation and anomaly detection logic, reducing reporting compilation time by 40% while eliminating manual data entry errors.
0
15
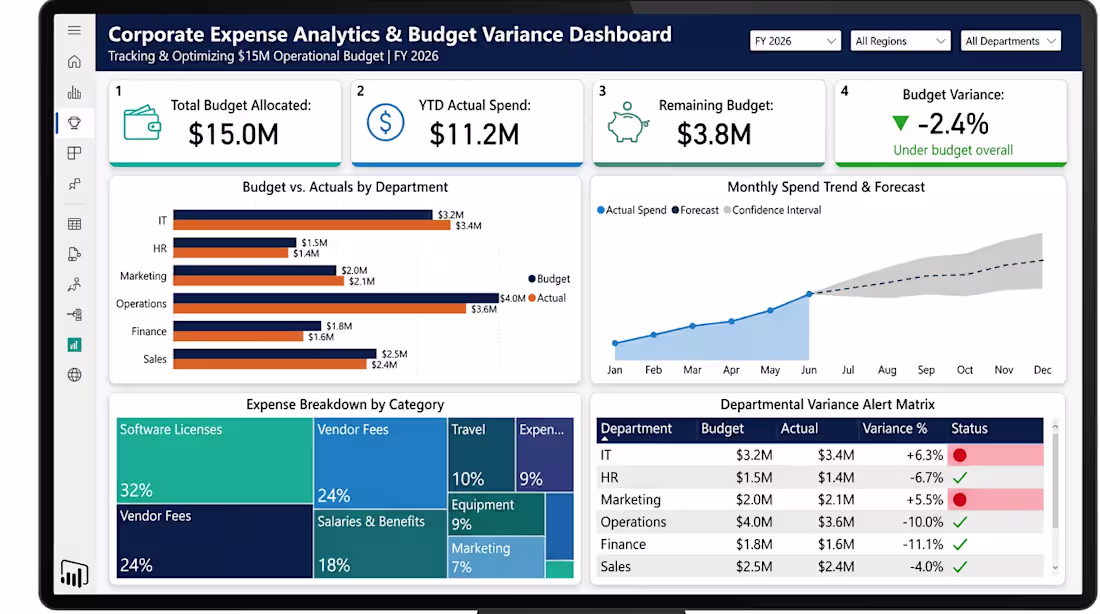
I have built an interactive financial intelligence dashboard in Power BI to track and optimize a $15M operational budget. Engineered automated data pipelines to consolidate cross-departmental expenses and compare real-time spending against forecasted budgets. Developed advanced variance-tracking logic to automatically flag over-budget departments and identify cost-saving opportunities, helping leadership reduce operational leakage by 8%
0
18
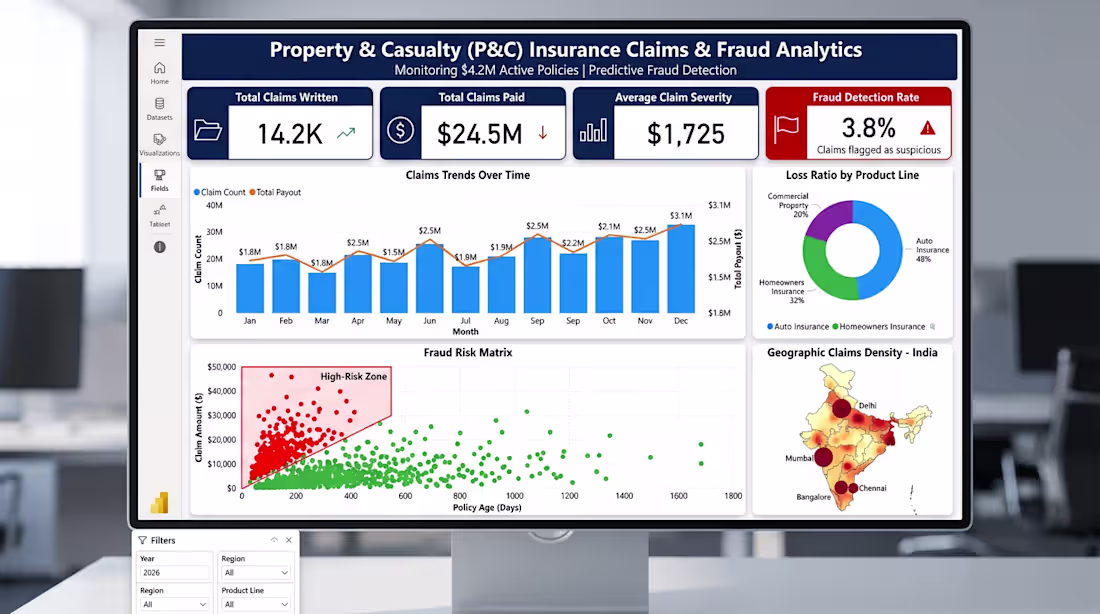
Developed an enterprise-level Power BI dashboard to monitor $4.2M in active insurance policies and detect fraudulent claim patterns. Engineered robust data models to track claim frequency, average severity, and loss adjustment expenses (LAE) across multiple product lines. Integrated a predictive fraud-scoring visual to help claims adjusters flag high-risk claims before payout, reducing leakage by 12%.
0
27
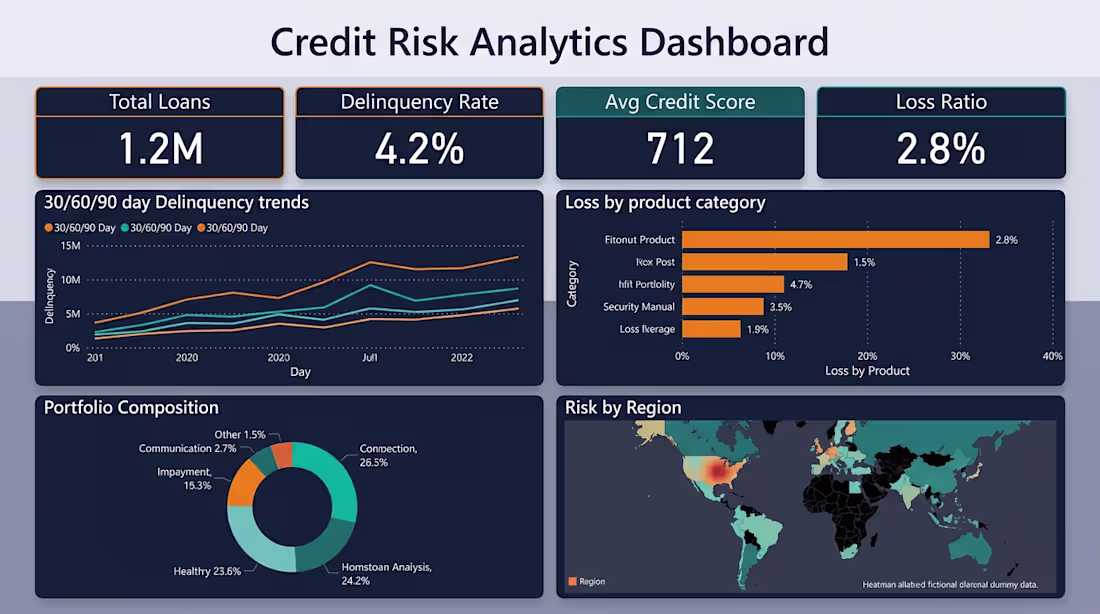
Designed a Credit Risk Analytics Dashboard to monitor a $1.2\text{M}$ loan portfolio. Integrated end-to-end data pipelines to surface critical KPIs like delinquency rates, product loss ratios, and geographical risk concentrations for executive reporting.
0
24